Written Commentary
MONTHLY COMMODITIES MARKET OVERVIEW
>>Read the complete, in-depth October 2026 Edition HERE
KEY HIGHLIGHTS
CORN
- 2026/27 average farm price was cut by 10 cents to $4.80 per bushel.
- Speculative selling has driven the managed money long position back under 200,000 contracts.
- US supplies nearly 500 million bushels above expectations from last month triggered a selloff testing the August lows.
- Chinese buying of US corn or more threatening forecast in South America from the Super El-Nino is needed to reenergize market bulls.
SOYBEANS
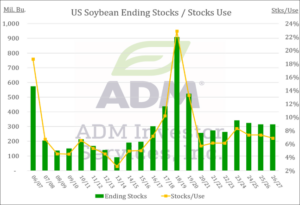
- 2026/27 average farm price left unchanged at $12.00 per bushel.
- Higher than expected yields in the US combined with favorable South American weather, despite presence of “Super El Nino,” has fueled speculative selling.
- With the managed money net long position at nearly 558,000 contracts across the soybean complex in early October (a new record) continued liquidation is expected.
- After a slow start, look for crush rates to pick up.
WHEAT
- 2026/27 average US farm price down 10 cents to $6.30 per bushel.
- Global importers have not turned to US wheat, favoring cheaper options.
- Low interior prices in Ukraine/Russia will likely trigger reduced plantings this fall.
- Peace talks in between US, Ukraine and Russia triggered another wave lower in price.
COCOA
- Third quarter grind data was robust. Europe was +3.2% from last year and Asia was +29%. North America was -2.5%, putting all three regions combined +9.7%.
- Ivory Coast’s cocoa grind in September was +46.6% from year-ago levels, according to the exporters’ association GEPEX. Total grind from the start of the season in October 2025 through September was +10.6% from the previous year.
- The strong grind shows confectioners are embracing chocolate again and restoring cocoa supplies after drawing them down when the cocoa price went to $13,000 per metric ton.
- The large grind also suggests offtake of cocoa beans for 2025/26 may be stronger than forecasts. This could mean lower ending stocks for 2025/26 and leave less cushion if 2026/27 production comes up short
- El Niño continues to threatens 2026/27 production with the potential for abnormally in west Africa, including Ivory coast and Ghana, the largest and second largest producers in the world.
COFFEE
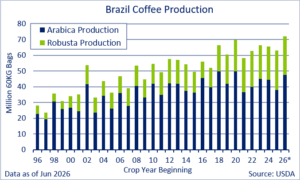
- ICE stocks have remained stubbornly low despite reports of strong Brazilian exports. Stocks bounced briefly in September after falling to 26 year lows, but they struggled to gain.
- Brazilian government data showed the nation exported 3.93 million bags of green coffee in September, the highest in 20 months and up 20.4% from September 2025
- Cecafe said Brazil exported 3.58 million bags of green coffee in September, up 3.2% from the same month last year. Arabica exports totaled 2.77 million bags, down 7% from a year prior, and robusta shipments totaled 814,000, up 65%.
- Brazil is exporting volumes from what was expected to be a record crop but whose harvesting work had been delayed due to rains.
COTTON
- Cotton has traded in a narrow range since putting in a low in early October. Harvest pressure limits gains, and supply/demand balance this year is in the middle of the historic range.
- The October USDA supply/demand report put US 2026/27 cotton production at 13.44 million bales, up from 13.20 million in the September update.
- Ending stocks were 3.80 million bales versus 3.60 million in September, putting the stocks/use ratio at 27.5% versus 30.1% last year and a five-year average of 28.5%.
- World 2026/27 production came in at 117.95 million bales versus 117.32 million in the September update.
SUGAR
- March Sugar reached new contract highs in October on declining production forecasts in key producing regions, with extreme heat and drought in Europe this summer damaging their sugar beet crop and a reduced monsoon in India this raising questions about their cane crop.
- In Brazil, heavy rains have slowed harvest and reduced the sugar content of cane. More rains in the first part of October raised the prospect of another low showing. It is getting late enough in the season that more rains could spark an early end to the 2026 crushing season.
- Brazil Agriculture Ministry data put center-south sugar production at 2.86 million metric tons in the second half of September, down 6% from the same period last year, but it was an improvement on the first half of the month.
- India has stopped ethanol production derived from sugar, which is another indicator of tight supplies.
CRUDE OIL
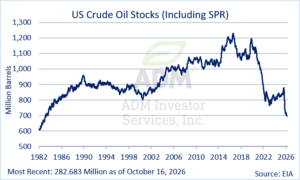
- The wars in Iran and Ukraine have sent nearby crude oil prices back above $110 per barrel for the first time since April. There has been no big change in the status quo, but there has been a step by step increase in the level of attacks, the area covered, and the nations
- The news that Mideast oil exports had climbed to their highest level since the start of the Iran war helped initiate a selloff from the September highs, but that did not last, as Iran and the Houthis stepped up their attacks.
- Iran widened its target range further outside the Strait of Hormuz to try to interrupt the ship-to-ship transfers that had helped boost the flows out of the Gulf.
- Houthi attacks have gotten more brazen, including an attack on a Saudi airport. Saudi Aramco recently evacuated its headquarters in Dhahran, which is on the Persian Gulf.
NATURAL GAS
- Nearby natural gas prices have fallen to their lowest level since early April, with mild weather has kept US heating demand low and US production running at record levels.
- US natural gas output declined in early October due to pipeline shutdowns in West Virginia, Kentucky, and Texas, but as the month progressed, production recovered.
- As of October 22, LSEG was reporting average gas output in the US Lower 48 states 111.6 billion cubic feet per day for the month October, still down from the record 113.3 bcfd reported in August and September, but daily output had recently climbed back to 113.3 bcfd.
- As of this writing, the 6-10 and 8-14-day forecasts had above normal temperatures over most of the lower 48 states, from the Rockies to East Coast, with some below normal temps emerging out west.
LIVE CATTLE
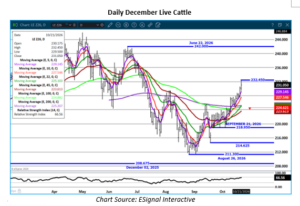
- When President Trump on August 21 announced increasing beef imports by 300,00 metric tons without tariffs, the intent was to lower beef prices. Cattle producers were upset and blamed it for the lower prices in September and the first half of October.
- On August 21, choice beef was $385.69, and select beef was $361.32. By September 15, choice was $376.08 and select $356.36. By September 30 choice beef was $382.79 and select $360.59. Cattle prices dropped during that period, from an average steer price was $225.53 on August 21 to $223.38 on September 15 and $221.98 by September 30. But were the lower prices due to the increasing imports?
- There also factors that were negative to beef prices. When the announcement was made, it was about a week before Labor Day, a peak time for beef consumption. From August 1-21, Choice beef went from $366.74 to $385.69 and select beef moved from $343.98 to $361.32. However, by September, 62% of US consumers were already buying less high-priced beef, such as steaks, as demand fell 2% from the same period in 2025. Demand for ground beef increased, with the ground beef index up 6% at 59.5 pounds from 2025.
LEAN HOGS
- Since the last peak on July 24, when December Hogs reached $80.82, hog and pork prices have been in freefall. As of October 21, the December Hogs made new contract low at $65.70. During the same time, the CME Pork Carcass Index fell from $97.48 to $73.02.
- The USDA is forecasting US pork consumption is for 2026 at to 49.6 pounds per capita, up slightly from 49.3 in 2025. Generational studies show Baby Boomers are the largest pork consumers, compared to GenX and Millennials that want quick and easy meal preparation.
- Pork’s major competition is chicken, and chicken broiler meat is averaging $2.03 per pound in 2026, slightly lower than $2.08 in 2025.
STOCK INDEX FUTURES
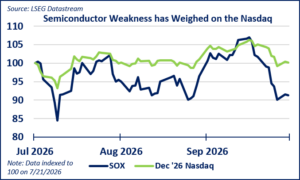
- Stock index futures have experienced broad upside trade, though a recent rise in credit default swap spreads has weighed on the S&P 500 and Nasdaq’s monthly gains. Despite the recent selloff in tech and the geopolitical backdrop, the market has shown low volatility relative to previous years. All three major indexes gained well over 1% between September 18 and to October 21. Pressure on the Dow has subsided as investors have rotated out of tech names in favor of consumer staples as they took defensive positions ahead of the Q3 earnings season.
- Concerns about debt financing have temporarily given way to renewed optimism about AI-related growth in the wake SpaceX’s Q3 earnings results. The SOX semiconductor index’s recent reversal is notable. The index is still up 55% YTD, but is currently at a level it has touched twice before over the past three months.
- Inflation worries have not subsided after the September CPI report showed no meaningful improvement on inflation trends, a factor that led the Fed to raise rates at their September meeting. Regardless, the overall picture for the equities remains supportive amid strong economic activity and favorable corporate earnings.
CURRENCIES
- The US Dollar Index increased roughly 1.5% between September 18 and October 20, thanks mainly to rising Treasury yields and declining confidence in the euro.
- As a whole, September’s data supported expectations of a Fed hike in December, while off-euro flows resulting from France’s fiscal worries further supported the dollar.
- Core inflation still rests above the Fed’s 2% target, and the market still expects at least one more rate hike this year.
- The euro fell 2.2% against the dollar between September 18 and October 20, as French fiscal concerns exerted downward pressure on the currency.
- French bond-market stress, which highlights the tension between the protests demanding more spending and bond markets demanding fiscal restraint, has reduced confidence in the euro.
INTEREST RATES
- US Treasury yields remain below the 24-year highs that were reached in September, but elevated oil prices continue to complicate the inflation outlook.
- Markets are assigning an 85% probability that Fed policy will remain unchanged this month.
- September’s CPI report showed that core price pressures grew quicker than expected at +0.3% m/m and +2.6% y/y.
- Headline inflation increased 0.6% on the month, matching expectations, while the annual rate accelerated to 3.7% from 3.4%.
GOLD
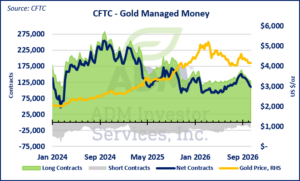
- December COMEX Gold fell roughly 5.8% from September 18 to October 20.
- Currently, money markets assign a 15% chance of a rate hike in October and remain fully priced for a move higher in December.
- That pricing has been little changed recently, reflecting the lack of a clear direction in gold, as the broader Fed and macroeconomic outlook remain a challenging environment.
COPPER
- COMEX copper futures are roughly unchanged after a volatile two-sided trade from September 18 to October 20, but cash LME prices have fallen from record highs recorded in September.
- Recently, uncertainty about whether US levies on copper imports will actually be imposed has contributed to the recent range-bound trading.
- If Democrats win big in midterm elections, prices could fall sharply if the Trump administration reconsiders imposing the tariffs. On the other hand, prices could rise further if the administration announces them.
Interested in more futures market commentary? Explore our Market Dashboards here.
