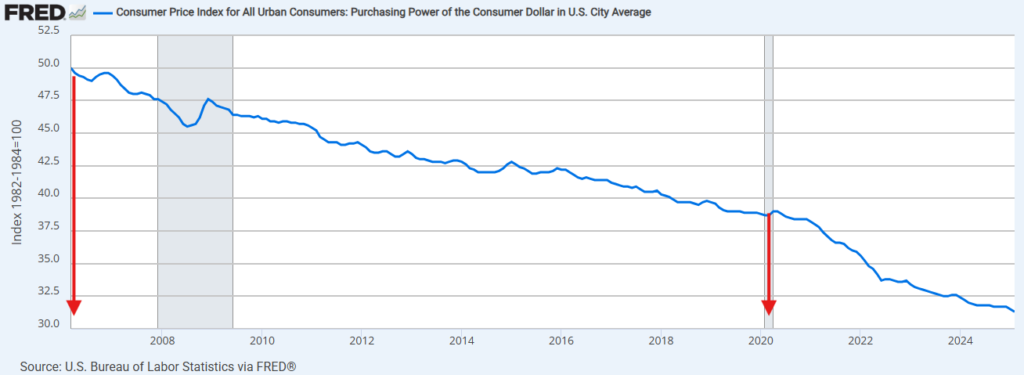
The Purchasing Power of the Consumer Dollar has decreased 37.4% since March of 2006 and it is down 19.1% from March of 2020. 1982-1984 is the benchmark of 100.0 for the dollar purchasing power. Purchasing power is down nearly 69% since then.
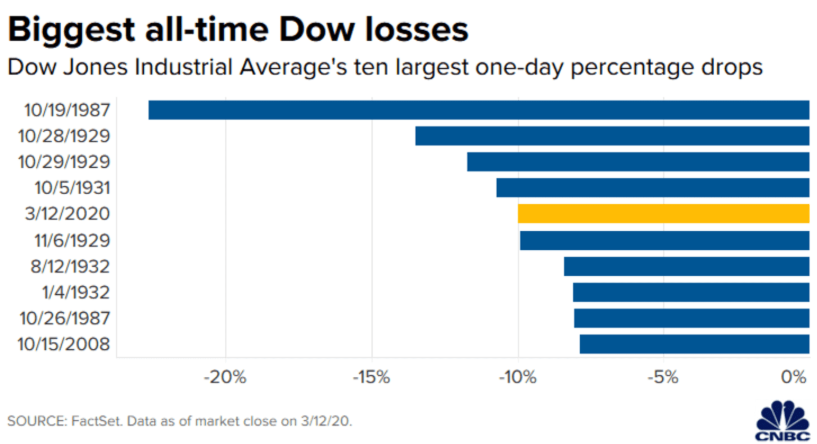
5 Years Ago Today The US equity market had one of it’s worst days in history following the World Health Organization announcing a global pandemic.
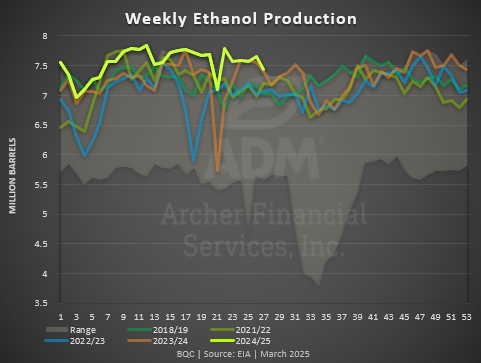
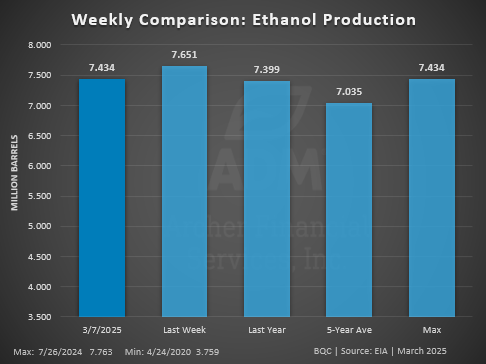
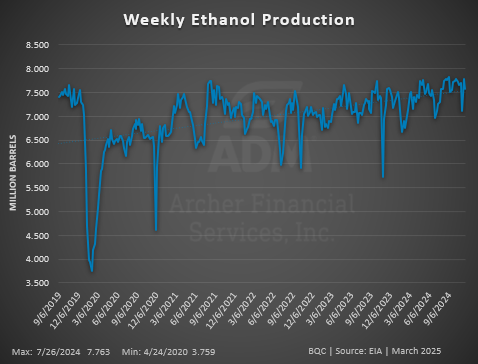
EIA Weekly Ethanol Production (For Week Ending 3/07/2025)
Ethanol Production dropped by -31K barrels per day for week endings 3/7 compared to the prior. This was below expectations but is on par with margins tightening over the last couple weeks as the corn market fell.
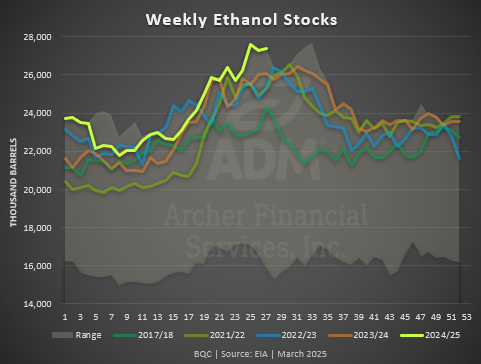
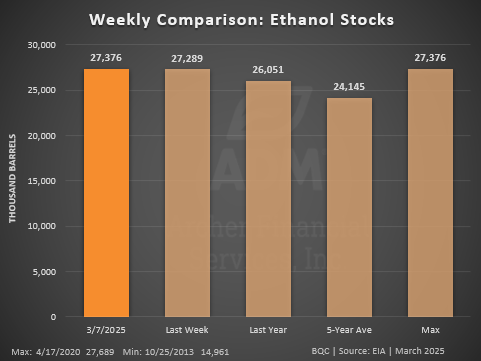
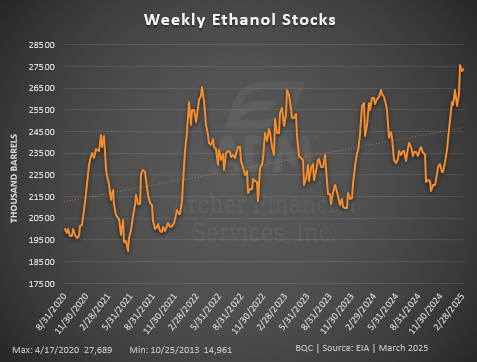
EIA Weekly Ethanol Stocks
Ethanol Stocks were on the upper end of expectations, at 27.4 million barrels
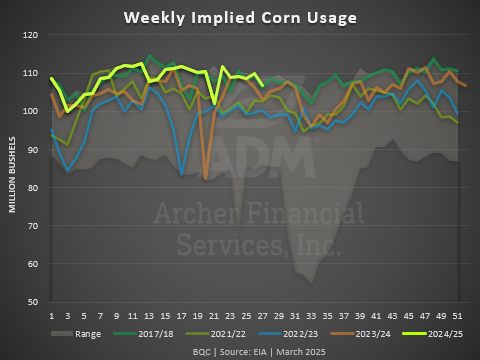
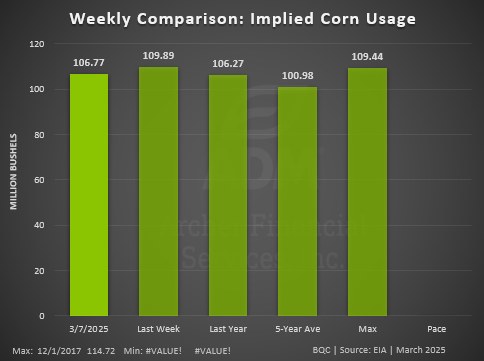
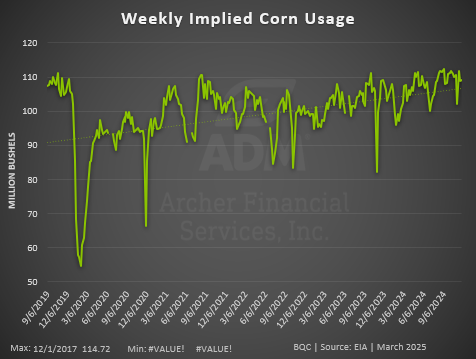
EIA Weekly Implied Corn Usage
Implied Corn Usage was about 15.2 million bushels per day, which is 300K bushels per day more than the set pace to reach the USDA usage estimate.
*Corn usage estimate subtracts sorghum used for ethanol based on USDA monthly grain crush report. Bushel to gallon conversion is based on implied yield: EIA monthly ethanol production divided by net (corn and sorghum) bushels crushed from USDA month report.
>>Interested in more commentary by Joe Mauck? Go HERE
Futures and options trading involve significant risk of loss and may not be suitable for everyone. Therefore, carefully consider whether such trading is suitable for you in light of your financial condition. The information and comments contained herein is provided by ADMIS and in no way should be construed to be information provided by ADM. The author of this report did not have a financial interest in any of the contracts discussed in this report at the time the report was prepared. The information provided is designed to assist in your analysis and evaluation of the futures and options markets. However, any decisions you may make to buy, sell or hold a futures or options position on such research are entirely your own and not in any way deemed to be endorsed by or attributed to ADMIS. Copyright ADM Investor Services, Inc.