Written Commentary
Macroeconomics: Recession fear officially made it’s presence known today as the US equity market has the worst day since September of 2022. The S&P 500 closed 2.7% lower and nearly -9% down from it’s mid-February highs. The VIX (Volatility Index) was up 20% today and +80% since mid-February. Uncertainty around global trade, the precise health of the US economy, and the volatility kicking weak hands off the roller coaster ride can all be considered reasons for today’s markets taking one to the chin. The US dollar still finishing the day below 104.00 on the index and crude oil was down over $1 today to close below $68/barrel. |
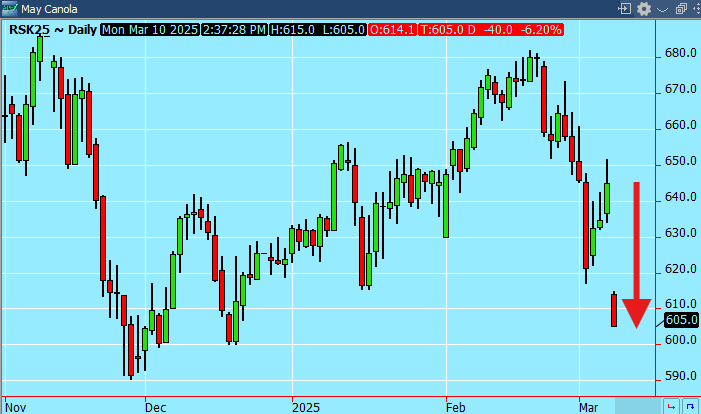
May Canola is down the limit, -40 Canadian dollars per ton. China’s announcement over the weekend of 100% tariffs was the major reason for the sell off. Nearby soybean oil is down -1.16 today as a reaction to the drop in canola oil values.
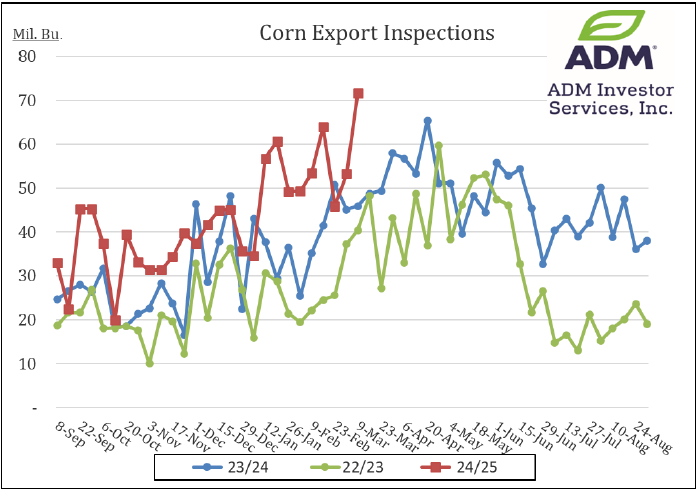
Corn Export Inspections: Only 48M bushels per week needed to reach the USDA estimates of 2.45 billion bushels.
CALENDAR SPREADS
Spread | Last | Chg | Full | % of FC |
CK25/CN25 | -6 1/2 | 0 | -21 1/4 | 31% |
CN25/CU25 | 27 1/4 | +1 3/4 |
|
|
SK25/SN25 | -14 1/4 | – 1/2 | -27 | 53% |
SN25/SQ25 | 2 3/4 | – 1/4 |
|
|
SN25/SX25 | 10 1/2 | -2 3/4 |
|
|
MWK25/MWN25 | -13 3/4 | – 1/4 | -20 1/2 | 67% |
WK25/WN25 | -14 3/4 | – 1/2 | -16 | 92% |
KWK25/KWN25 | -12 3/4 | – 1/4 | -16 1/4 | 78% |
COST OF CARRY
Daily Trading Limits: Corn $0.30 (expanded $0.45); Soybeans $0.85 (expanded $1.30); Minneapolis Wheat $0.60 (expanded $0.90); KC Wheat $0.40 (expanded $0.60); Chicago Wheat $0.40 (expanded $0.60)
Futures Settlements & Technicals
Symbol | Close | Chg | High | Low | Support | Resist | 20-Day | 50-Day |
CK25 | 472 | +2 3/4 | 474 3/4 | 466 1/2 | 470 | 480 | 488 1/2 | 486 |
CN25 | 478 1/2 | +2 3/4 | 481 | 472 3/4 | 475 | 485 | 493 1/2 | 489 3/4 |
SK25 | 1014 | -11 | 1032 1/2 | 1012 1/4 | 1010 | 1022 | 1039 1/4 | 1043 |
SN25 | 1028 1/4 | -10 1/2 | 1046 | 1026 3/4 | 1022 | 1035 | 1054 | 1056 |
SQ25 | 1025 1/2 | -10 1/4 | 1042 1/2 | 1024 1/4 | 1023 | 1039 | 1051 1/2 | 1052 1/2 |
MWK25 | 604 1/2 | +11 3/4 | 606 | 592 1/4 | 598 | 610 | 620 1/2 | 613 |
MWN25 | 618 1/4 | +12 | 619 | 606 1/4 | 610 | 624 | 633 1/2 | 624 |
WK25 | 562 1/2 | +11 1/4 | 566 | 553 1/4 | 556 | 570 | 579 | 569 1/2 |
WN25 | 577 1/4 | +11 3/4 | 579 3/4 | 567 1/4 | 570 | 583 | 592 1/2 | 580 3/4 |
KWK25 | 578 1/2 | +13 3/4 | 583 1/2 | 566 | 575 | 589 | 595 1/4 | 583 1/4 |
KWN25 | 591 1/4 | +14 | 595 1/4 | 578 3/4 | 584 | 595 | 607 1/4 | 593 1/4 |
SMK25 | 302.3 | -2.10 | 307.5 | 302 | 300.00 | 308.00 | 302.10 | 309.20 |
BOK25 | 42.26 | -1.16 | 43.55 | 41.98 | 42.00 | 43.50 | 45.40 | 44.70 |
>>Interested in more commentary by Joe Mauck? Go HERE
Futures and options trading involve significant risk of loss and may not be suitable for everyone. Therefore, carefully consider whether such trading is suitable for you in light of your financial condition. The information and comments contained herein is provided by ADMIS and in no way should be construed to be information provided by ADM. The author of this report did not have a financial interest in any of the contracts discussed in this report at the time the report was prepared. The information provided is designed to assist in your analysis and evaluation of the futures and options markets. However, any decisions you may make to buy, sell or hold a futures or options position on such research are entirely your own and not in any way deemed to be endorsed by or attributed to ADMIS. Copyright ADM Investor Services, Inc.
