Written Commentary
CORN
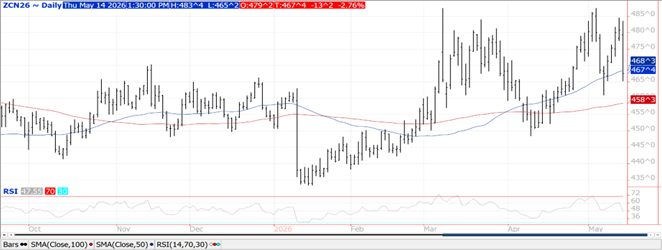
Prices were down $.09-$.12 today while spreads also weakened with many making new lows. July-26 has violated support at this month’s low and its 100-day MA. Next support is the April low at $4.48 ½. Dec-26 made a new low for the month while also slicing through its 50-day MA at $4.86 ¾. Speculators sold 27k contracts yesterday, reducing their net long position to 350k contracts, probable closer to 325k after today. O.I. yesterday was down 12k contracts. The BAGE held their Argentine production forecast at 61 mmt, just above the USDA est. of 59 mmt, while harvest has reached 32%. US corn acres in drought rose 1% LW to 26%. Near-term sentiment remains bearish. No date has been set for the US Senate to vote on E-15. The bull needs to be fed and right now slim pickin’s in the buffet line.
SOYBEANS
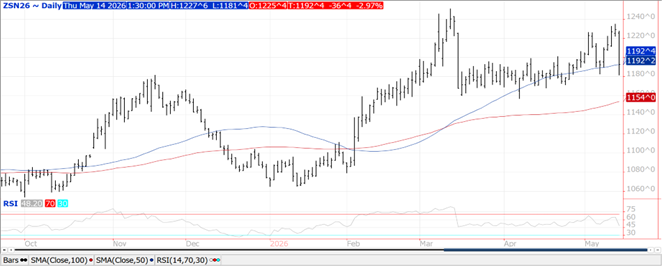
Mostly lower trade across the complex as crush margins soared. Beans were $.11-$.15 lower, meal ranged from $1 lower to $2 higher while oil ranged from 15 lower to 20 higher. Bean spreads weakened while product spreads firmed. July-26 beans fell to a new low for the month with next support at the 100-day MA currently at $11.55. Nov-26 held support above this month’s low at $11.64 ¾. Choppy trade in meal after the USDA announced a flash sale of 155k tons of meal to Italy. Prices peaked just below their November high at $343 before pulling back. Despite the volatility it was an inside day in July-26 oil. While the Trump Admin. claims victory for the US farmer in securing Ag. deals with China, lack of clarity on the specifics has tipped market sentiment lower. US weather is also bearish for the Ag. space with moderate to heavy rainfall across the Midwest over the next week. Crush margins surged $.22 to $3.71 bu. nearing their modern day high while bean oil PV held at 52.5%. The BAGE held Argentine production forecast steady at 48.6 mmt, vs. the USDA est. of 48 mmt. Harvest jumped 24% to 58%, well above the historical average. With the speculative selling the past 2 days not captured in today’s CFTC-COT update, look for another record net long position by MM’s in the soybean complex. NOPA crush at 212 mil. bu. was slightly below the Ave. est. of 214 mil. however, within the range of guesses. While down 6.2% from March-26, it was well above the 190 mil. from April-25. Bean oil stocks at 1.947 were a touch below the average guess of 1.954 and down 4.5% from April. Implied census crush at 215 mil. bu. brings YTD crush to 1.776 bil. up 8.2% from YA vs. the revised USDA forecast of up 7.6%. To reach the USDA est. crush May through Aug. will need to reach 854 mil. bu. vs. 804 YA.
WHEAT
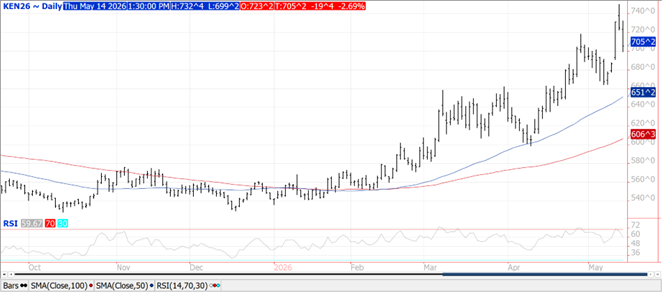
Prices were pummeled $.17-$.22 today. Support for CGO July-26 is at $6.17 ¾, KC July-26 filled a chart gap between $6.87 ¾ – $6.90 ¾ with next support at $6.66 ¼. The Kansas crop tour final yield est. was 38.9 bpa, below the 5-year Ave. of 45.5 and the lowest since 2023. Their production forecast at 218 mil. bu. would imply their harvested acres at roughly 5.6 mil. acres. The USDA pegged Kansas yields at 37 bpa with production at 214.6 mil. bu. The USDA harvested acreage est. at 5.8 mil. represents 83% of the planted acres, below the historical average of 92%. The BAGE pegs 26/27 Argentine production at 21.3 mmt, while well below 25/26 at 29.5 mmt, it’s in line with the USDA est. of 21 mmt. US WW acres in drought rose another 1% the past week to 71%. The market remains mindful that final WW production has exceeded the May estimate in each of the last 3 years, including up 117 mil. in 2023, the last major drought in the SW plains. Felt like the market found quickly prices didn’t need to rally too much to ration US wheat demand with US already positioned well above other exporting countries.
Futures and options trading involve significant risk of loss and may not be suitable for everyone. Therefore, carefully consider whether such trading is suitable for you in light of your financial condition. The information and comments contained herein is provided by ADMIS and in no way should be construed to be information provided by ADM. The author of this report did not have a financial interest in any of the contracts discussed in this report at the time the report was prepared. The information provided is designed to assist in your analysis and evaluation of the futures and options markets. However, any decisions you may make to buy, sell or hold a futures or options position on such research are entirely your own and not in any way deemed to be endorsed by or attributed to ADMIS. Copyright ADM Investor Services, Inc.
