Explore Special Offers & White Papers from AFS

Ag Market View for July 29.22

SOYBEANS

Soybean ended higher. Starting Monday, US Midwest 14 day weather forecast is warm and dry. If US 2022/23 demand remains at 4,505 mil bu, US stocks to use ratio would drop to a record 2.2 pct. There were no August soybean and soymeal deliveries. SQ tested 16.71. SU tested 15.16. Next resistance is near 15.50. Soyoil supported by new US energy bill that would add 400 million dollars over 5 years to Green energy demand and could increase demand for US soyoil. Malaysian palmoil, Dalian soyoil and palmoil, Matif rapseed oil and Canada canola oil futures rallied on the energy news.  Noon weather maps were mixed. One map added rains next week as ridge moves far enough east to allow gulf moisture to move across the Midwest. The one map that has been suggesting warm and dry Midwest weather over the next 2 weeks is still warm and dry. Managed funds remain on the sideline due to extreme weather volatility. End users are also on the sideline hoping for better US Midwest August weather.

ADMIS Research Team
Corn Chart
Back of Dollar Bill

CORN

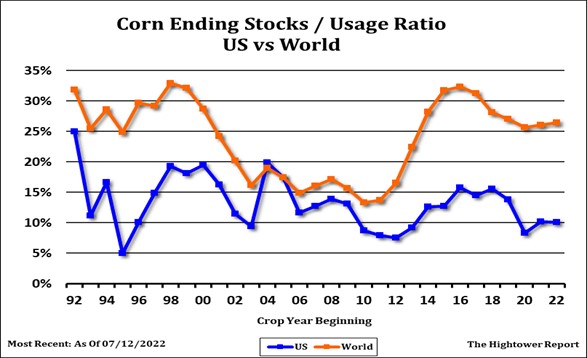
Corn futures may be also adding an US weather premium. Starting Monday, US Midwest 14 day weather forecast is warm and dry. One crop watcher dropped US yield 3.5 bpa to 173.5. They traveled through IA and MN and suggest US yield could drop to 170 if IA, NE, KS, MO, TX and OK are warm and dry over next 3 weeks. EU weather is warm and dry. Some estimate EU corn crop closer to 50 mmt than USDA 68. CU tested key resistance is near 6.32 but backed off on talk of increase Ukraine corn exports. Some feel 20 vessels of mostly corn will be shipped soon out of Odessa port. Key will be how much additional corn can be loaded and shipped. Most look for Mondays USDA corn crop rating to drop especially in US SW corn states. IA and IL crop weather and size to of CU is worth 7.00 or 5.50. CU may be trying to establish a trading range between 6.00 and 6.50 until more is known about US weather and impact on US final carryout. Assuming US harvested corn acres stay near 82.0 million and demand near 14.570, (14,865 this year)1 bpa drop in yield would drop US carryout 82 mil bu. A 7 bpa drop would drop carryout 575 mil bu or to only 895. USDA est World 2022/23 corn stocks at 312 mmt vs 312 this year. Of the total China is 204. Of the 108 left US is 37, Ukraine 12. Brazil 8  and EU near 8.5. Noon weather maps were mixed. One map added rains next week as ridge moves far enough east to allow gulf moisture to move across the Midwest. The one map that has been suggesting warm and dry Midwest weather over the next 2 weeks is still warm and dry.

WHEAT

Wheat futures have turned lower. WU is near 8.07. KWU is near 8.79. MWU is near 9.06. Talk of two Ukraine corn vessels being shipped to Africa offered resistance to wheat futures. Few Ukraine wheat vessels quality may be only feed. Fact Russia is aggressively offering wheat or export is also weighing on wheat futures. It remains hard to define actual Russia wheat export price with floating export tax. Russian farmer has also been a reluctant seller given talk of record crop but low quality and record higher domestic prices. USDA est World wheat exports at 205 mmt 200 last year. Russia is 40 mmt vs 33 last year, EU 35 mmt vs 29 ly. Australia 24 vs 27, Argentina 13 vs 16, Ukraine 10 vs 18 and US 22 vs 22. USDA est World wheat imports at 203 mmt 196 last year. SE Asia  is 26 mmt vs 26 last year, Middle east 23 mmt vs 23 ly. N Africa  29 vs 27, EU 5 vs 3, China 9 vs 9. World wheat end stocks are est near 267 mmt of which China is 141 vs 280 ly when China was 142. 

Futures and options trading involve significant risk of loss and may not be suitable for everyone.  Therefore, carefully consider whether such trading is suitable for you in light of your financial condition.  The information and comments contained herein is provided by ADMIS and in no way should be construed to be information provided by ADM.  The author of this report did not have a financial interest in any of the contracts discussed in this report at the time the report was prepared.  The information provided is designed to assist in your analysis and evaluation of the futures and options markets.  However, any decisions you may make to buy, sell or hold a futures or options position on such research are entirely your own and not in any way deemed to be endorsed by or attributed to ADMIS. Copyright ADM Investor Services, Inc.

Latest News & Market Commentary

Explore Special Offers & White Papers from Archer Financial Services

Get Started

Contact Us Today