Written Commentary
Power Bytes Newsletter
by Aishwarya Mahesh, ADMIS Energy and Environmental Quantitative Researcher
Trillions of dollars are now riding on the assumption that AI’s growth curve will continue unbroken. Investors, policymakers, and utilities are betting on gigawatt-scale commitments, new transmission lines, and entire substations devoted to computational power (“compute”). It’s an era of faith in infrastructure, that if we build enough power and chips, the returns will follow. Yet behind the optimism lies an uncomfortable truth, volatility has a way of humbling certainty.
Right now, hyperscalers and data centers operate inside unprecedented power-market volatility. For datacenters, the priority is not to trade power for profits, it’s structuring hedging positions to protect GPU utilization and keep compute productive.
For years, static long-term Power Purchase Agreements (PPAs), locked in costs and secured renewable supply, which worked in an era of steadier load growth and grid conditions. That toolkit no longer covers the multi-dimensional risks that drive delivered cost of compute (DCoC): volatile fuel prices, grid scarcity, and congestion on the supply side collide with AI workload surges and utilization inefficiencies on the demand side. These forces interact multiplicatively, not additively, pushing hyperscalers to stand up energy trading desks that actively manage exposure rather than merely “set and forget.”
Additionally, GPUs depreciate every hour, whether busy or idle. The costly outcome isn’t just a higher utility bill, but idle chips when workloads need to run. Power may be a smaller line item than GPU capex on paper, but it drives the swing. At campus scale, a few scarcity hours or imbalance intervals can move the quarter by massive figures and stall training or jeopardize inference SLAs. Annual averages hide these tail risks, and treating power as a static input lets a few bad hours decide outcomes. Hedging can turn volatile hourly exposure into a planned expense that protects margins on assets whose value decays with time and ensures every GPU hour is monetized.
The Illusion of Certainty: PPAs in the AI Era
For most of the last decade, the PPA was the cornerstone of datacenter power strategy. The structure was simple and elegant. Sign a long-term contract with a wind or solar project, pay a fixed price for each megawatt-hour produced, and claim the renewable credits. Developers got predictable cash flow and hyperscalers got stability and proof of additionality. It was a win-win in an era when load growth was linear and grid congestion modest.
But stability on paper doesn’t always translate to stability at the meter. Every power plant connects to a node, a specific location on the grid with its own price. Datacenters buy power at their hub, a regional clearing price that reflects congestion, scarcity, and losses. When the lines connecting those two points clog, their prices drift apart. The PPA fixes the price at the project’s node, but the datacenter still pays whatever is cleared at its hub.
That spread, also known as basis risk, is where PPAs begin to fail hyperscalers. A Virtual PPA might hedge the average annual price at a project node, but the power a datacenter actually consumes is priced at its local hub, and those two can diverge violently in the hour that matters.
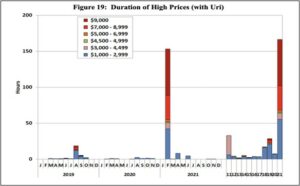
Now imagine a Winter Storm Uri-type hour. A 100 MW campus sits in West Texas. The local hub clears $2,000/MWh. You hold a $40/MWh VPPA tied to a wind project node.
- If power is delivered: you still buy 100 MWh at the hub → $200,000. The VPPA settles at the project node, not your meter; depending on the node price, it might pay you a few thousand or cost you a few thousand. Either way, your effective outlay is still roughly $200k. The contract fixed a project price, not your delivered price in the hour that matters.
- If power is cut (forced curtailment/outage): your energy charge is ≈ $0, but GPUs sit idle and depreciate; the VPPA’s node-based cashflow doesn’t bring compute back. If you were long the hub (forward/cap), you’d still get paid on the spike, cushioning the downtime or funding backup generation. If you have backup power, the hedge payout plus backup cost often makes staying online rational.
Even in non-crisis hours, PPAs show limitations. They are static instruments: fixed volumes, long tenors, and little room to adjust as a campus scales or migrates. Financing dynamics have changed too. There are higher interest rates, longer timelines and more collateral requirements mean what looked like a cost hedge is now a long-term commitment with exposure.
While PPAs will remain foundational as they build projects and anchor sustainability strategies, they are no longer sufficient. In the new era of volatile loads and constrained grids, hyperscalers are discovering that electricity is not just a fixed input. It is a traded commodity, one whose risks and costs must be managed dynamically. Most large-scale data centers sit inside organized wholesale markets like PJM and ERCOT, where electricity is traded. These regions give hyperscalers a toolkit far beyond the traditional PPA.
Risk Before Reward
The right playbook starts by sizing where that volatility hits the stack. We break this down into demand-side exposure, supply-side exposure, and the systemic risks that propagate through collateral, liquidity, and grid constraints. While not a comprehensive list, the sections that follow will begin to build that risk map.
Supply-Side Volatility Drivers
Power is the upstream input risk to the “delivered cost of compute”. These are the factors before the meter that decide whether the right megawatt reaches the right node and hour, and at what price. We’ll organize the supply risks to consider along three axes: what you buy, where you buy, and when you buy. Physical volatility cuts across all three. The same weather and grid conditions can shift the marginal fuel, limit transfer capability, and push scarcity into specific hours.
What You Buy — Fuel Exposure and Generation Mix
Natural gas has become the backbone of hyperscaler reliability. As AI clusters scale past the limits of renewables and grid imports, firms have quietly leaned into gas as the bridge fuel, which is dispatchable, dense, and politically endorsed as a stabilizer amid the global power crunch. Several states now explicitly encourage gas buildouts tied to industrial and datacenter demand, arguing that firm generation must keep pace with load growth.
Gas-fired plants can ramp in minutes that keep GPUs online through renewables’ lulls, and are easier to finance than next-generation nuclear. But this choice ties datacenter economics to one of the most geopolitically exposed commodities in the world.
In 2025, Henry Hub, the U.S. benchmark natural gas price, swung between ~$2.6 and ~$5.5 per MMBtu (Bloomberg Terminal), enough to move marginal generation costs by roughly $20/MWh at typical heat rates. The drivers weren’t local load but global LNG flows, weather shocks, and conflict risk (including Asian/European import demand shifts and Middle East shipping uncertainty). In real time, that showed up as a ~15% May spike and winter contracts back above $4.20 were linked to colder U.S. forecasts, stronger LNG exports, and geopolitical supply concerns (Market Minute). Because many hyperscalers buy on fuel-indexed structures, that upstream gas volatility passes directly into wholesale power prices.
Where You Buy — Location and Deliverability
Location and deliverability are the practical realities between a generator and your rack. Power prices and reliability are set locally because grids clear at thousands of nodes and the wires between them are finite. When those wires are full or a zone is short on firm capacity, the local price and reliability risk rise. “Deliverability” is simply whether the system can move enough power to your node, in the hour you need it, without hitting transmission limits or curtailments
In constrained datacenter corridors like PJM, that constraint shows up as higher local energy and capacity costs and a greater chance of emergency actions. In short: where you site a campus and how easily the grid can deliver power to that exact place determines what you pay and how stable your supply is.
PJM’s 2024 auction priced how much regions pay to reserve reliable power. In Northern Virginia (Data Center Alley) it cost $444.26/MW-day, versus a PJM average of $269.92, about 65% more because the local grid is tighter. The next year, that local strain showed up system-wide. The 2026/27 auction cleared at the price cap, $329.17/MW-day, signaling broad scarcity rather than isolated pockets. (Utility Dive)
When You Buy — Temporal Scarcity and Capacity Tightness
The cost of power concentrates in specific windows such as heat waves, cold snaps, wind/solar lulls, and steep evening ramps, which cause reserve margins to compress. Those hours are few, but they set the bill. A small slice of ~100–200 critical hours can drive a disproportionate share of annual spend. In other words, timing defines price. (Potomac Economics)
What makes those windows expensive isn’t average demand but it’s coincidence, the chance of a high load arriving exactly when supply is constrained (weather, outages, low renewables, transmission limits). Markets respond with scarcity pricing, so the last megawatt bought in those hours costs multiples of the daily norm.
The planning implication is to hedge for the hours that hurt, not just average megawatt-hours. That means shaping coverage to peak blocks, capping exposure in scarcity intervals, and adding short-duration buffers (batteries, backup, load relief) that ride through these episodic periods of stress.
Underlying Physical Volatility — Weather, Fuel, and Reliability
Beyond price, there is the question of having power at all. Extreme heat, deep cold, hurricanes, and wildfires can knock out plants and transmission more often than before. The Department of Energy warns blackout hours could rise 100× by 2030, from a few hours today to more than 800 hours per year (U.S. Department of Energy).
For AI datacenters, an outage is lost work. One hour down at a 100 MW site is 100 MWh not served, roughly 80,000 GPU-hours gone, plus the time to checkpoint and restart. Operators are responding with backup generators, batteries, and load-relief programs that turn a hard outage into a managed curtailment. In Texas, a 2025 rule lets ERCOT temporarily curtail large datacenter loads during emergencies to keep the grid stable.
Demand-Side Volatility Drivers
Demand-side volatility begins in how power converts to useful compute. It is set by the pace of growth, shaped by how jobs arrive and run, and bounded by how well the hardware turns watts into work. Layered on top is the research tempo and the concentration of power users such as OpenAI, Meta, Google, and others whose training and deployment decisions can move the needle for entire regions. That reshapes the workload mix and timing, so the yield of compute per watt moves even when supply is unchanged.
AI Scaling and Forecast Error — The Macro Driver
The growth curve of AI workloads is exponential, but its timing is chaotic. Even grid operators can’t keep up. ERCOT’s 2030 data-center forecast more than doubled in a year from ~30 GW to ~78 GW, as planners realized AI load was arriving faster than expected. (ERCOT LTLF) Similar resets are playing out elsewhere as both utilities and hyperscalers chase a moving target.
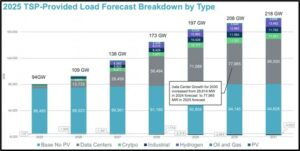
Source: ERCOT
Scaling laws sit at the center of this uncertainty. Research from OpenAI and DeepMind showed that performance tends to improve predictably with more data, parameters, and compute, setting a north star for “bigger is better” (Hoffmann et al). There is an active debate about the durability and limits of these curves. Data scarcity, diminishing returns, and architectural shifts could bend them, but they remain the working assumption for most frontier labs. The energy cost of “bigger” also rises superlinearly, moving from a 1-billion to a 100-billion-parameter model can multiply training energy on the order of 50×. Jared Kaplan estimates an AGI-scale run at 10^29–10^30 FLOPs, which is roughly 100,000× today’s largest training jobs (The Scaling Era).
Forecasts oscillate between undershoot and overshoot, pushing operators from spot exposure and curtailments to stranded capacity. Global estimates now put AI data-center demand compounding at ~25%% over the next several years—far above historical trends—yet any single year can jump higher on a breakthrough (SemiAnalysis). The result is forecast volatility that becomes financial volatility: procurement, siting, and grid upgrades are priced against a target that accelerates and shifts at the same time.
AI Workload Variance — The Engine of Fluctuation
Volatility tracks the model lifecycle. Start with training. This is when you teach a model from large datasets so it learns patterns. Think of it as a multi-day production run that pulls hard and steady on power. Starts and “save points” create sharp ramps. In principle you can choose the hour these runs begin, but in practice they line up with research and product deadlines, so a slip can land right in an expensive evening window.
After that comes post-training. These are tune-ups that adapt a model to a specific task or style. They are smaller jobs, but they fire often and on short notice. Many small tune-ups layered on top of the baseline load can push a site over its fixed volumes for minutes or hours, which shows up as spot purchases or forced pauses elsewhere.
Then there is inference, which is the model answering questions or generating outputs for users. It behaves in two very different ways. Some inference is queued work you can do later in big groups. You collect requests and process them overnight or in other cheap hours. Other inference is real-time and must respond immediately to a user click or API call. Real-time serving peaks with human activity and product launches, which often coincides with on-peak grid pricing. You cannot move that demand without breaking response-time targets, so you change the recipe instead. Two common tools are larger request groupings and quantization. Larger groupings feed the GPUs more efficiently when loads are high. Quantization means running a lighter version of the model that uses fewer bits per calculation, which cuts energy per answer during the busiest hours.
Teams also run dummy workloads. These are smoke tests, dry runs, synthetic data generation, or parameter sweeps that do not appear on the main calendar. Each is small, but in aggregate they add a few percent to monthly energy and could create unplanned peaks that tip the site into spot exposure.
The sharpest volatility comes from collisions across these steps. A large training start on a weekend can run straight into a Monday feature launch that lifts real-time inference. For a few hours the campus is short against its on-peak block exactly when local prices separate from the hub. The practical fix is simple to state, perhaps, hard to execute. Give big training jobs a price-gated start window, shift queued inference into cheaper hours, switch serving into a peak mode that uses larger groupings and quantization, and keep a small on-site buffer to shave the ramp. In practice those moves lower effective $/GPU-hr, reduce nodal basis exposure, and turn more of each purchased megawatt into useful compute.
GPU Utilization Inefficiency — The Conversion Layer
GPU utilization is the share of a campus’s installed GPU capacity that is actually doing work at a given moment. On paper, a datacenter might have tens or hundreds of megawatts of GPUs “lit,” but in practice those chips are not running at 100% all day. (Modal) As discussed, training comes in waves, batch inference can get pushed into cheaper windows, real-time inference follows user traffic, and there are always periods where jobs are waiting on data, networking, or coordination. The result is a load pattern that moves up and down inside the box you have already built and wired, rather than sitting flat at the top of it. (RedHat)
That gap between booked capacity and moment-to-moment use is its own source of volatility, and also where the opportunity lives. When utilization dips, the site is drawing materially less than its contracted or physical ceiling, which creates headroom to act as controllable load or participate in ancillary services without touching critical workloads, especially in constrained regions.(Emerald AI) When utilization spikes, the same site can briefly overshoot the load shape assumed in a simple PPA or flat block, leaving a slice of demand exposed to real-time prices. In both directions, it is not the GPU count but the utilization profile that decides whether you are over- or under-hedged in a given hour. The more that profile is understood and shaped by separating flexible work like batch inference from immovable work like real-time serving, the easier it becomes to line up power hedges and grid.
Concentrated Power-User Effects — The Distribution Layer
At the industry level, AI power demand is extremely concentrated. A handful of frontier labs and hyperscalers own most of the critical IT capacity on the planet. Structure Research’s self-build data center survey puts the top four alone, Google, Microsoft, Amazon, and Meta, at roughly 78% of global self-built critical IT power capacity. (Structure Research). In practice, that means a small group of firms decides when the next gigawatts of AI load appear on a grid, when retraining waves hit, and when new clusters are energized or delayed.
That is concentration risk in a very literal sense. If these firms line up on the same side of a decision, pulling forward model launches, adopting a more compute-intensive training recipe, or accelerating a regional buildout, the impact is measured in multi-gigawatt swings on a few transmission systems, not spread across thousands of smaller buyers. If they pause hiring, delay a generation of models, or shift spend to another region, the same grids can be left with slower-than-expected load growth and underutilized capacity. For anyone hedging power around AI campuses, the key uncertainty is not millions of independent customers; it is the timing and strategy of fewer than ten.
Research and Business Cycle Volatility — The Human Layer
Beyond the technical drivers, there’s a very real human and economic element to all this. We can call it “hype cycles” or research-driven volatility. If AI investment and deployment surge occurs in a given quarter (say cloud providers selling more AI services, or a new VC wave funding AI startups), power demand can increase double-digits quarter-over-quarter in those data centers. We saw hints of this in 2023–2024 as generative AI took off and cloud operators reported rapid growth in GPU hours. The reverse is just as sharp: an “AI winter,” a budget reset, or a deliberate efficiency push can flatten or even reverse that growth for a few quarters.
Research breakthroughs add another twist. A new recipe such as RL-style fine-tuning can suddenly become the standard, and it usually comes with a heavier compute bill per model. In simple terms, Reinforcement Learning trains a model by letting it try things, scoring the answers, and adjusting based on that feedback instead of just learning from a fixed dataset. Once a lab or platform adopts these methods, the same product roadmap now implies more training passes, more post-training experiments, and extra rounds of “try, score, adjust” for alignment or safety. (AWS) Those shifts rarely line up neatly with prior power forecasts.
On top of that are the calendars people actually live by seen through product launches, marketing events, conference demos, even paper deadlines. To hit those dates, teams may run training 24/7 for a month, including peak daytime hours, instead of mostly at night. The result is macro-level cyclicality layered onto the daily load curve. In high-spend quarters, an energy contract sized to the new peak can look sensible; a quarter later, if training intensity drops back, that same contract can leave the campus over-hedged and selling back at a spread. In typical industrial loads, demand moves with production schedules and seasons. In AI, it also moves with budget cycles and ideas.
Systemic Volatility Drivers
Layered on top of direct supply and demand drivers is a deeper, systemic uncertainty, the macro backdrop of AI. They influence how fast AI demand materializes and how quickly the power system can respond. They do not change the core thesis that AI is likely to be a real, durable source of electricity demand. But they do mean the journey there will not be a smooth curve, governed by cycles of exuberance and caution. A useful risk frame is not “Will AI go to zero?” but “How do we stay solvent and flexible across a world where AI demand could be 5× higher or 5× lower than today’s base case for several years at a time?” Some key areas to keep in mind here are the investment cycle, policy and regulation, and the cost of capital and build-out.
AI Investment Cycle (Bubble vs Boom)
The investment cycle is where the “AI bubble” debate really shows up. Right now, capital is flooding into chips, models, and data centers on the assumption that scaling laws will keep paying off. If that optimism cools, even temporarily, workloads can flatten faster than infrastructure can adjust. We have seen versions of this movie before. In the late 1990s, telecoms overbuilt fiber for the dot-com era, much of it went dark after the crash, and then that “excess” capacity quietly became the backbone of the modern internet. (Energy Institute at Haas) Some people see today’s AI buildout as a near one-to-one replay, others are more optimistic. If AI delivers real productivity and new products, today’s aggressive build could look, in hindsight, like cheap optionality on a valuable technology. If not, utilities and hyperscalers risk sitting on stranded megawatts and long-dated contracts. The point is not that one outcome is certain, but that the path is likely to involve periods where demand overshoots and grids strain, followed by periods where capacity runs ahead of usage. After the telecom bust, investors and planners are once bitten, twice shy, which makes this timing risk a source of volatility in its own right.
Policy and Regulation
No market outruns the policy that governs it.
Carbon pricing is the cleanest example. An €80/ton CO₂ price in Europe adds on the order of $30/MWh to gas-fired power (S&P Global, 2025), nothing about the grid changed, but the cost stack did. A U.S. analogue, whether via a federal rule, RGGI-style expansion, or a de facto carbon standard, would instantly reprice any contract that is not already tied to low-carbon supply. Offsets and Renewable Energy Credits (RECs) soften that, but their own prices are drifting up and their credibility is under more scrutiny.
Market design tweaks cut just as deep. ERCOT’s Performance Credit Mechanism, capacity constructs in PJM and ISO-NE, or new scarcity pricing rules change how reliability is paid for and how painful it is to be a large, inflexible load. Curtailment mandates and “controllable load” programs turn what used to be a simple “always on” assumption into a choice between paying more or occasionally turning off. (Yes Energy)
Trade and industrial policy is another unpredictable layer. Tariffs, export controls, and equipment quotas don’t target data centers directly, but they reshape the cost of everything upstream of them such as transformers, switchgear, solar panels, batteries, even LNG flows. A tariff on Chinese power equipment or new export restrictions on critical metals can raise project costs, delay build schedules, and ripple into wholesale pricing.
The risk is not any single policy so much as assuming the current regime is static when it is, by design, cyclical.
Capital Markets
The last piece is capital markets and underwriting risk. New generation, storage, and transmission are long-lived assets financed against expectations of future demand. Higher interest rates and tighter credit mean developers need richer revenues, which shows up as higher capacity prices and PPA offers. When hyperscalers sign 10–15 year contracts to anchor those projects, they are effectively underwriting the forward curve of both power and AI demand. If workloads grow faster than expected, those deals look prescient; if workloads plateau, they can turn into stranded costs that have to be worked off or sold back into the market at a discount. At the same time, using financial hedges pushes more of this into marked-to-market space. Collateral calls and accounting volatility tie the cost of compute to the state of global funding conditions. (Goldman Sachs)
Taken together, these systemic forces shape both sides of the coin. They influence how fast AI demand materializes and how quickly the power system can respond. They do not change the core thesis that AI is likely to be a real, durable source of electricity demand. But they do mean the journey there will not be a smooth curve—it will be governed by cycles of exuberance and caution, policy lurches, and shifts in the cost of money. A useful risk frame is not “Will AI go to zero?” but “How do we stay solvent and flexible across a world where AI demand could be 5× higher or 5× lower than today’s base case for several years at a time?”
Non-Linear Interactions: Multiplicative Supply–Demand Risk
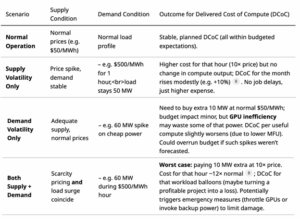
Individually, the above supply and demand factors each create volatility, but the worst outcomes occur when they interact simultaneously. These interactions are multiplicative. It is not “1+1=2” so much as 1×1 turning into 10 in terms of impact on delivered cost of compute. To illustrate,
The most intuitive case is peak demand landing on peak price. A training run that pushes load from 50 MW to 60 MW is manageable at $50/MWh. A scarcity hour that lifts price from $50/MWh to $500/MWh is painful but finite if load stays flat. When both arrive together, the result is a 20 percent increase in volume at ten times the unit cost, and the hour goes from a routine expense to something an order of magnitude larger. Renewable-heavy systems often create this coincidence by design. Evening ramps, when solar falls away and reserves tighten, are also when many AI teams launch jobs or process the day’s data. The grid and the workload share the same clock.
Reliability interacts with utilization in a similar way. A short outage during an idle period destroys little of value. The same outage in the middle of a large training job can erase millions of GPU-hours of work and the energy that fed them. Some operators now think in terms of “GPU-hour risk” rather than generic outage rates. The loss from one MWh of unserved energy is close to zero when machines would have been idle anyway. The same missing MWh is extremely costly when it interrupts a long training run that must be restarted or extended. Outage risk and workload intensity multiply, they do not simply add.
Slower variables stack as well. A fuel price shock that doubles gas costs in the same year a new cluster doubles demand raises the bill higher than expected. Higher prices are now applied to a larger base of consumption, and the total spend can jump by far more than either driver alone would suggest.
Understanding co-occurrence is crucial. The tail of the distribution is fat because there is a non-trivial chance that several bad conditions line up in the same hours. Thinking in terms of long-run averages or “typical” days hides this structure. The practical implication is that hedging and operations need to target the joint tail, not just each variable in isolation.
The scenario table that follows makes this explicit by mapping a few stylized combinations of supply and demand conditions to their effect on delivered cost of compute
Engineering the Hedge
Once you map out how sharply power volatility interacts with GPU productivity, the strategic shift becomes obvious. The world’s largest compute operators are doing more than buying electricity, they are underwriting the energy systems that keep their clusters alive. At this moment, a hyperscaler looks less like a corporate IT buyer and much more like a small utility that is responsible for securing hundreds of megawatts and protecting the output of assets that depreciate by tens of millions per month. Like a utility, its real obligation is not just to find cheap power, but to make sure the power is there when it is needed the most, which means planning for the worst hours, not the average ones. Power risk has become compute risk, and compute risk is the business.
As discussed, the traditional tools, 10-year PPAs at a single node, fixed-price blocks sized to an “average” load, were built for different conditions. They do not survive the world we’ve just described. A static contract priced on average hours cannot hedge peak hours, cannot anticipate basis blowouts, and cannot protect GPU output when scarcity events hit at the exact moment workloads peak. That gap between inflexible contracts and unpredictable supply/demand patterns is the space where trading desks emerge.
The leading hyperscalers have already begun the transition. Meta registered ATEM Energy LLC as a wholesale market participant. Google and Microsoft already runs 24/7 clean energy programs that require hourly load-matching, which is functionally a trading problem with carbon constraints (Bloomberg). Crusoe takes vertical integration even further, securing fuel, generation, and compute in one stack, because controlling power is the only way to guarantee compute.These are early versions of a new operating model in which energy is a core competency. If operators think through this intelligently, the upside is power stops being a black box and starts looking like something you can steer, day by day.
Illustrative Example: 100 MW Hyperscaler Under Uri-Type Scarcity Conditions
To assess how a hyperscale AI facility would perform under ERCOT grid stress comparable to Winter Storm Uri (February 2021), when real-time prices hit the $9,000/MWh cap, we model a 100 MW AI training campus operating through a four-hour scarcity event. This simple exercise explores three operating paths:
- Unhedged operation through the price spike
- Forced or voluntary outage due to untenable conditions
3. Hedged curtailment structured as a market or bilateral trade
Source: ERCOT
Technical and Economic Assumptions
GPU Hardware and Power Density: The modeled facility is equipped with NVIDIA H100-class hardware (80 GB Hopper architecture). The DGX H100 reference system integrates eight GPUs per node, drawing approximately 10.2 kW at full load (NVIDIA). This implies roughly 100 nodes per MW—or 10,000 DGX nodes for a 100 MW deployment—housing approximately 80,000 H100 GPUs. This scale aligns with industry estimates for large training superclusters.
Value of Compute Output: GPU-hour economics are derived from prevailing on‑demand cloud pricing for H100 instances (2024–2025 rates of roughly $3–$7 per GPU-hour). (Intuition Labs) Using a representative midpoint of $3.75/GPU-hour, the compute value of a fully utilized 100 MW campus equals:
80,000 GPUs × $3.75/hr ≈ $300,000/hour
This represents the notional market value of compute output, rather than direct operating cost.
Operating Cost Under Scarcity Pricing. At the ERCOT price cap of $9,000/MWh, a 100 MW load faces an hourly electricity cost of $900,000. These figures form the basis for the scenario analysis below.
Scenario A – The Unhedged Victim
In this baseline case, the data center continues operating through scarcity conditions, paying the full real-time rate.
- Power cost: $900,000/hour
- Compute value: $300,000/hour
- Net position: –$600,000/hour, or –$2.4 million over 4 hours
The operator effectively spends three dollars on power for every dollar of compute output, with no protection against forced curtailment if grid conditions deteriorate. Some industrial consumers experienced this outcome during Winter Storm Uri, continuing operations at enormous expense before later being involuntarily cut off. For hyperscalers, this represents both financial and operational mismanagement.
Scenario B – The Hard Landing
Here, operations cease early in the event, either due to ERCOT-directed load shed or pre‑emptive shutdown.
- Power cost: $0/hour
- Compute loss: $300,000/hour, totaling $1.2 million in deferred output over 4 hours
Financially, Scenario B avoids catastrophic energy expenses at the cost of temporary productivity loss. The outcome is breakeven in cash terms but reflects halted utilization and idle assets. Operationally, it helps stabilize the grid, mirroring many consumers’ experience during Uri who were either curtailed or voluntarily shut down.
Scenario C – The “Virtual Peaker” Trade
In reality, only part of a hyperscale AI campus is economically flexible. Cooling infrastructure remains online to protect hardware, while GPU compute can be throttled, paused, or migrated. Industry estimates suggest cooling accounts for roughly one‑third to nearly 40% of total data center energy use, with hyperscale and AI facilities often at the lower end due to better PUE and advanced cooling. For a 100 MW AI campus, this analysis therefore assumes 30 MW of non‑flexible cooling load and 70 MW of flexible compute load, a conservative midpoint consistent with those benchmarks.
Structure of the Strategy
- Hedge the non‑flexible cooling load (30 MW).
Cooling cannot be turned off without risking equipment and service integrity, so it is treated as firm load and hedged via long‑dated blocks, PPAs, swaps, or structured products that largely remove it from real‑time price risk. The effective marginal cost of power for this 30 MW slice remains close to the hedge strike, not the scarcity price. - Curtail compute load (70 MW) during scarcity.
When real‑time prices jump to the $9,000/MWh cap, the operator curtails 70 MW of GPU compute for the duration of the 4‑hour event. Compute value at full load is $300,000 per hour for the 100 MW campus, so the curtailed 70% corresponds to $210,000 per hour of deferred compute output and $840,000 over 4 hours. - Layer in scarcity‑linked hedges that reward curtailment.
The hyperscaler holds a financial or physical arrangement that pays for dropping up to 70 MW when prices exceed a trigger (for example, $8,000/MWh). In a Uri‑type event, this could take the form of a bilateral deal with a generator such as Vistra: during scarcity, Vistra sells an additional 70 MW into ERCOT at the prevailing $9,000/MWh price, while the data center agrees to curtail 70 MW of load and is paid $8,000/MWh for that curtailment. The campus is effectively “selling” its 70 MW load reduction at $8,000/MWh, leaving roughly $1,000/MWh of upside to Vistra as the intermediary. The hourly payment to the hyperscaler is:
70 MW × $8,000/MWh= $560,000/hour
Over 4 scarcity hours, this yields ~$2.24 million in revenue.
Net economic outcome
During the 4‑hour Uri‑style window:
- Power cost for compute: $0 (compute is curtailed).
- Cooling power cost: effectively fixed/hedged and not exposed to $9,000/MWh in incremental terms.
- Hedge/curtailment revenue: $2.24 million.
- Deferred compute value: $840,000.
The net economic gain is therefore approximately:
$2.24M− $0.84M ≈ $1.40M
Either way, Scenario C turns the crisis into a profit center. Instead of losing money or just breaking even, the data center actually makes money by effectively renting its capacity to the grid. Scenario C is far from being hypothetical, this is basically what happened with some ERCOT participants. Riot Blockchain effectively did Scenario C in 2023’s heat wave, getting paid tens of millions to curtail. (CNBC). Hyperscalers could strike bilateral deals with generators as demonstrated with the Vistra example. The financials can be arranged such that both parties share the upside. In effect, the data center becomes a “virtual peaker plant,”.
Historical Mirrors
The hedge logic itself now mirrors commodity-intensive industries. In the 1990s and 2000s, jet fuel had swollen to 30–50% of operating costs, and spot swings routinely wiped out quarterly margins. (“Hedging Jet Fuel Price Risk,” 2015) So carriers started hedging, not to become commodity traders, but because “not hedging” became too dangerous. They used crude and refined-product futures as cross-hedges, learned the pain of collateral calls, and discovered that stabilizing cost per seat-mile required financial engineering as much as operational discipline. Oil is the clearest precedent. Starting in the 1950s, they integrated vertically across production, refining, transport, and trading to control both price risk and basis spreads. Owning the value chain was cheaper than absorbing market friction at every interface. Vertical integration didn’t eliminate volatility, but it let them see it, shape it, and (critically) profit from managing it. The trading arms of the majors became some of the most sophisticated risk shops because the commodity was too central to leave to chance.
The organizational implication is that compute operations themselves are becoming energy-aware. They’re meeting electricity at the same inflection point that jet fuel hit in the 2000s and crude hit in the 1970s. While firms don’t need the full refinery model, they do need the mindset: visibility, optionality, and risk shaping.
Energizing Intelligence
In the coming years, the intersection of AI and power markets will test how adaptable both industries really are. Electricity has already moved to a first-order constraint. It decides where clusters go, how fast models can be trained, and who can afford to keep scaling when the grid is tight. The choice for datacenters is either remain price takers on that constraint or start treating power like something that can be designed, forecast, and steered with the same seriousness as architectures and training runs.
The call to action is not “become an energy hedge fund.” It is to make energy part of the core control loop of AI. Build teams that understand both nodes and GPUs. Let workload schedulers see price and reliability, not just capacity. Use contracts, hedges, and load flexibility to shape exposure instead of hoping averages hold. If everyone can buy the same chips, the durable edge goes to the firms that can keep those chips fed, reliably and at a known cost, no matter what the power system throws at them.
Sources
https://www.utilitydive.com/news/pjm-interconnection-capacity-auction-prices/753798/
https://arxiv.org/abs/2203.15556
https://newsletter.semianalysis.com/p/ai-datacenter-energy-dilemma-race
https://modal.com/blog/gpu-utilization-guide
https://www.redhat.com/en/blog/optimizing-gpu-roi-inference-day-training-night
https://arxiv.org/html/2507.00909v1
https://www.structureresearch.net/product/2025-global-hyperscale-self-build-data-centre-report/
https://www.yesenergy.com/blog/how-isos-and-rtos-are-addressing-large-load-growth-in-2025
https://docs.nvidia.com/dgx/dgxh100-user-guide/dgxh100-user-guide.pdf
https://intuitionlabs.ai/articles/h100-rental-prices-cloud-comparison
>>If you like this article, check out Aishwarya Mahesh on Substack!
