Written Commentary
MONTHLY COMMODITIES MARKET OVERVIEW
>>Read the complete, in-depth September 2026 Edition HERE
KEY HIGHLIGHTS
CORN
- In In the September WASDE report, US 2025/26 corn ending stocks were cut 22 million bushels to 1.922 billion, in line with expectations.
- 2026 US production cut 213 million bushels to 15.80 billion, in line with expectations.
- Harvested area down 86,000 acres to 88.506 million, while yields were cut by 2.2 bushels per acre to 178.5.
- New crop feed usage was lowered by 150 million bushels.
- US 2026/27 ending stocks were lowered 86 million bushels to 1.567 billion, 40 million above expectations.
- World 2026/27 stocks were cut by 2.5 million metric tons to 272 million, slightly above expectations.

SOYBEANS
- In the September WASDE report, US 2025/26 soybean ending stocks were left unchanged at 325 million bushels, 10 million above trade expectations.
- Higher domestic meal usage was offset by higher imports.
- 2026 US production was up 16 million bushels to a record 4.535 billion, 35 million above expectations.
- Harvested area was up 100,000 acres to 85.881 million, with average yield raised 0.1 bushels per acre to 52.8.
- New crop exports were up 25 million bushels to 1.685 billion .
- 2026/27 US ending stocks were lowered 10 million bushels to 310 million, 10 million above expectations.
- 2026/27 global ending stocks little changed at 124 million metric tons, in line with expectations.
WHEAT
- In the September WASDE report, US 2026/27 all-wheat ending stocks were left unchanged at 717 million bushels, in line with expectations.
- US production will be updated on September 30th.
- Shifting exports sent HRW stocks up 15 million bushels, SRW up 5 million, and white wheat down 20 million.
- World 2026/27 ending stocks were up 3 million metric tons to 276 million versus expectations for no change.
COCOA
- December Cocoa reached its highest level in 11 months on August 31 and then proceeded to drop 23% in value in just three weeks.
- Concerns about a dry spell in West Africa (egged on by talk of a “super El Nino “) faded as rains started to reach the region.
- Ivory Coast has established a new marketing system this year to meet EU reporting requirements for anti-deforestation regulations. As a result, they started their marketing year on September 1 rather than their usual date of October 1. As of September 20 some 20,500 metric tons were estimated to have arrived, which is about half of the arrivals for the first two weeks in October last year, but that is understandable.
- An uncertain global outlook could reduce cocoa consumption, as confectioners reducing the amount of chocolate their products, a trend that started when prices reached $13,000 per ton in 2024.
COFFEE
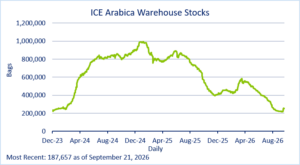
- December Coffee came close to contract highs in late August on a peak of concern over the slow harvest pace from Brazil, but then a revision of estimated exports changed the picture in a heartbeat.
- The market turned technically bearish it failed to take out contract highs from September 2025, which ushered in a round of profit taking.
- The market also experienced a fundamental turnaround after the Brazilian exporters association Cecafé corrected the coffee shipment data on its website. The site had been showing cumulative totals for export registrations running 22.5% behind last July, but they later corrected the data to show export licenses were up 20.5% as of August 26, thus turning the outlook suddenly bearish.
- Brazil’s 2027/28 crop is getting off to a strong start, with early flowering following unusually high rainfall. Favorable weather is still needed to ensure development, and there is a risk of quality problems or that El Nino leads to severe heat and or bacterial and fungal disease.
COTTON
- US cotton crop conditions are dicey, especially in Texas, the largest producing state in the nation, but a record fund net long position sparked a steep selloff when the weekly conditions report showed a modest improvement in late August.
- Crop conditions have been wavering back and forth the last few weeks, but overall they are not very good. As of September 20, 34% of the US crop was rated good/excellent versus 47% at a year prior and a five-year average of 42%. Texas was 15% G/E versus a five-year average of 30%.
- There were 65% with bolls open versus a five-year average of 58%.
- It is too late in the season for rain to help the crop. Instead, heavy rains could cause quality issues if they fall on open bolls.
SUGAR
- The sugar market faces a lineup of bullish fundamentals from lower production for key global producers, but the funds have a large net long position, which leaves the market vulnerable to heavy selling if support levels are taken out.
- The European beet crop, especially in France, was hit by extreme heat and drought this summer, and this was on top of lower plantings.
- India has seen an uneven monsoon, and lower production expected.
- The Indian government has allows 1 million metric tons of imports this year after domestic refined prices reached all-time highs in advance of their festival season.
- Thai production expected to be down, primarily due to growers switching to more lucrative cassava.
CRUDE OIL
- When Iran closed the Strait of Hormuz this spring, Saudi Arabia started diverting more oil via pipeline to the Red Sea via the East-West pipeline.
- Iran-backed Houthi rebel in Yemen attacked ships traveling through the Bab-al-Mandeb Straight, interrupting shipping and reducing flows out of the Red Sea into the Indian Ocean. The Houthis upped their game in September, gaining control over more lands around the Bab-al Mandeb. The same week, militants in Iraq sympathetic to Iran launched an attack on the East-West Pipeline forcing a temporary shutdown and stopping the flows to the Red Sea.
- There are also indications that despite all the blockages, a fair amount of oil is still making it out of the Persian Gulf. Ship-to-ship transfers of oil outside the Strait of Hormuz are estimated around 2.4 million barrels per day for September, up from 1.4 million in August and 730,000 in July. Total exports through the strait are estimated at 6.1 million bpd, up from 4.4 million in August, 5.3 million in July and just shy of the 6.2 million in June, which was the peak since the war started at the beginning of (In February, exports were 16.0 million bpd.) (Data according to Reuters, LSEG, and Kpler.)
- The possibility of some sort of peace agreement resurfaced in September when Iran offered to reopen the strait within seven days if the United States were to take initial steps toward easing military pressure, including an end to the US blockade of Iranian ports. That proposal coincided with the meeting of the UN General Assembly where representatives of the US and Iran met to talk about reestablishing peace proposals.
NATURAL GAS
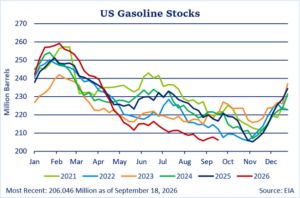
- US natural gas in storage is above the five year average but below a year ago. As of September 11, US gas in storage was -3.9% from a year ago and 2.9% above the five-year average.
- The warmest summer on record supported cooling demand and helped limit US storage builds despite record US production.
- Above normal temperatures in the forecast through October 7 across the US lower 48 states will help support cooling demand in the south, but as the season move on, those above normal temperatures also mean lower heating demand, especially in the north.
- LNG export demand remains firm and helps offset higher production.
LIVE CATTLE
- Bearish news slammed the cattle market in August. On August 21 President Trump announced tariff-free beef imports of 300,000 metric tons for 90 days. The following Monday the US reopened the border for Mexican cattle, lifting the quarantine from the New World Screwworm. The market was also absorbing news on August 13 that Tyson Foods was closing two beef facilities and selling another and an August 21 Cattle on Feed Report showing the on feed up 2% from the a year earlier.
- At the time of President Trump’s import announcement, US beef imports for 2026 were already up 14% 2025. The additional imports are believed to be from Brazil and Argentina.
- On August 21 the choice boxed beef cutout was valued at $385.69/cwt, with the select cutout at $361.32. By September 18, choice had fallen to $371.33 and select $353.70. The cuts most affected have been chucks, rounds, flanks and plates, which are the the ones that go to grinders. Choice rib sections have kept the cutout value from falling even more, gaining more than $25 due to buyers storing for the peak demand period-from Thanksgiving through New Years, when 70% of rib primals are used.
LEAN HOGS
- Hog and pork prices have been under pressure despite cumulative US federal hog slaughter as of September being down 937,249 head from the same period in 2025.
- One reason is increased competiton with imported ground beef.
- USDA Economic Research Service is forecasting US pork consumption to rise modestly in 2026, to 49.6 pounds per capita from 49.3 pounds in 2025.
- Consumers are buying more pork trimmings-based products and fewer cuts like pork roasts, chops, or hams.
STOCK INDEX FUTURES
- Stock index futures have experienced downside action, as rate hike expectations and a rise in oil prices predominantly affected cyclical, financials and consumer facing blue chip names, yet volatility has been relatively low. From August 18 to September 17, the December S&P was -0.9%, the December Dow -2.9%, and the December Nasdaq -0.45%. Heavy pressure in the Dow came from investors rotating out of health care, consumer staples, consumer discretionary, industrials, and interest-rate-sensitive shares.
- The VIX continues to reflect one of the calmest periods in 2026, having closed at a 2026 low on August 14. It has closed lower only six times Since President Trump began his second term. Still, geopolitical risk remains in play as US-Iran strikes and renewed Houthi strikes on Saudi oil infrastructure has raised oil prices and added to upside inflation risks.
- The macro narrative has changed moderately from July. Inflation worries have not subsided after the August CPI report showed no meaningful progress on inflation, a factor that led the Fed to raise rates at their September meeting. Market expectations for a hike at the September meeting surged. Regardless, the overall picture for the equities remains supportive amid strong economic activity and favorable corporate earnings.
CURRENCIES
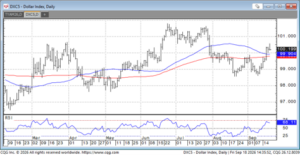
- The US Dollar Index increased roughly 0.6% between August 18 and September 17, thanks to a resurgence in Fed tightening expectations and the subsequent rate increase. Core inflation still rests above the Fed’s 2% target, and the market expects one more hike this year. Money markets are priced for an additional hike by December after the Fed’s dot plot revealed most policymakers expect another increase. Fed policy expectations will continue to play an outsized role in dollar direction.
- The euro fell nearly 1% against the dollar between August 18 and September 17, as market expectations of Fed tightening outweighed a rate hike from the European Central Bank and bets for additional tightening ahead.
- As of September 17, markets were priced for around 37 bps of ECB tightening by year-end and 81 bps of total tightening over the next 12 months. President Lagarde has retained a hawkish bias, and the current inflation environment across the globe favors tighter policy as well. Second-round inflation effects from the initial surge in energy prices add potential for an additional hike by year-end.
- The yen gained roughly 1.9% between August 18 and September 17, as expectations of quicker tightening path from the Bank of Japan and a violent reversal of an overcrowded bearish-yen/carry-trade position strengthened the currency ahead of the BOJ’s September rate decision.
INTEREST RATES
- Corporate supply, government debt, and Fed rate hike expectations have driven yields higher were behind the increase in yields over the past month.
- Inflation expectations have remained anchored over the past few months.
- The Treasury Department’s announcement that it would double the size of its buyback operations for longer-dated debt has led traders to test the department’s ability to manage prices at the long end, which it has so far been unable to do.
- Long end Treasury yields are no longer at the mercy of Fed rate hike expectations or oil prices. Instead, focus remains on over the size of the US debt and ever-increasing supply.
GOLD
- December COMEX Gold fell roughly 0.5% from August 18 to September 17, as near-term Fed tightening expectations surged and real yields rose modestly. The dollar recovered recent losses during that period as well.
- The challenges gold has faced in recent months are still present, and the advent of a potential Fed tightening cycle presents downside risks.
- With core CPI at 2.4%, headline inflation running well over the Fed’s 2% target, and the Fed’s recent hike, the market has priced in significantly more Fed tightening than it did in August.
- Gold is still trading as a pure macro asset, with a relatively tight inverse relationship to the dollar and US 2-Year yields.
COPPER
- COMEX copper futures prices rose roughly 2% on volatile two-sided trade from August 18 to September 17, and cash LME prices touched record highs in September on worries over lower LME inventory, shipments to the US amid expectations of US tariffs, and broad demand for AI infrastructure and energy transition.
- Supply worries continue, as warehouse inventory is shipped to the US. The LME cash contract is no longer trading at a premium to the three-month benchmark, as some copper has flowed back into the LME system. The premium was trading near $270 on August 18 and $545 on September 17.
- Available LME stocks are sitting near 140,000 metric tons, and COMEX stocks are sitting at more than 670,000 tons
Interested in more futures market commentary? Explore our Market Dashboards here.
