Written Commentary
MONTHLY COMMODITIES MARKET OVERVIEW
>>Read the complete January 2026 Edition HERE
KEY HIGHLIGHTS
CORN
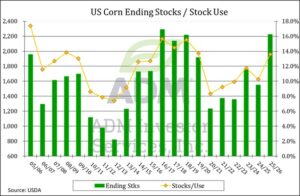
Corn prices plunged to five-month lows following the release of the bearish USDA production and stocks data in January. The USDA raised US 2025/26 corn production by 269 million bushels to 17.021 billion, which was 470 million bushels above expectations. Harvested acres rose yet again to 91.258 million, up 1.21 million from November. The already-record US yield rose another 0.5 bushels per acre to 186.5. Partially offsetting the higher supply was a 90 million-bushel increase in demand to a record 16.370 billion. This resulted in ending stocks increasing by 198 million bushels to 2.227 billion, 255 million above expectations and a nine-year high. As we expected, the USDA left their export forecast and usage for ethanol unchanged at 3.20 billion and 5.6 billion bushels, respectively.
SOYBEANS
As we forecasted in last month’s overview, spot soybean prices slipped back to the $10.25-$10.50 area despite China holding to their commitment to purchase 12 million metric tons of US soybeans. Key for prices pulling back to near their October lows has been a favorable weather pattern in South America, and contributing to the selloff was the neutral to bearish data from the USDA earlier this month. In their January supply/demand report, USDA increased US 2025/26 soybean production by 9 million bales to 4.262 billion, 30 million above expectations. Total demand was cut 43 million bushels, as the USDA finally caved in by lowering exports 60 million bushels Partially offsetting that was a 15 million cut in crush.
WHEAT
Since breaking into fresh lows in mid-December, Chicago and Minneapolis Wheat prices have moved nowhere but sideways. Higher global inventories limit upside potential, while prices already at or near multi-year lows limit aggressive new selling. While the January USDA data certainly wasn’t bullish, it wasn’t nearly as bearish as it was for corn. US 2025/26 wheat ending stocks were increased by 25 million bushels to a six-year high of 926 million, due to lower feed usage. Pre-report expectations were for little to no change. December 1 stocks at 1.675 billion bushels were 40 million above expectations. December 1 stocks/Q1+Q2 usage at 1.35 matches year-ago levels. Global 2025/26 wheat ending stocks rose another 3.4 million metric tons to 278 million versus expectations for 276 million.
COCOA
March Cocoa prices collapsed in January from low grind numbers, good growing weather in West Africa, and oversupply at Ivory Coast ports. Europe’s fourth-quarter cocoa grind data came in at 304,470 metric tons, down 8.3% from a year earlier. This was a bigger than the 4.8% decline in the third-quarter and much bigger than a pre-report expectation from a Bloomberg poll calling for a 3% decline. Europe’s grind total 2025 was 1.327 million tons, down 5.9% from 2024 and the lowest since 2015. Asia’s fourth-quarter grind, was 197,000 metric tons, down 4.82% from the same period in 2024, and the North American grind was 103,117 tons, up 0.35% from the same period in 2024. This was the second straight quarter the North American grind was above year-ago levels, though the fourth-quarter increase was not as impressive as the 3.2% increase in the third quarter.
COFFEE
March Coffee saw a brief rally in early January on heated political rhetoric between President Trump and Colombian President Petro in the wake of the capture of Venezuelan President Maduro. Colombia is the second largest supplier of arabica coffee to the US after Brazil, and traders were fearful of tariff on their exports, such as the one on Brazil last fall that sent prices back near all-time highs. Things calmed down after the two spoke on the phone, and there are plans for Petro to meet with Trump at the White House in early February. There are still no official data for the 2026/27 Brazilian coffee crop, which will be harvested starting in May, but growing conditions have improved considerably over the past two months, with timely and what appears to be adequate rains.
COTTON
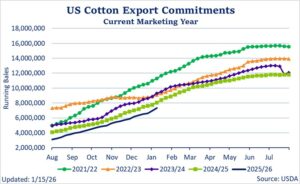
March Contract fell to a new contract low at 62.97 on December 16 and appeared to reject that price level, but the market managed only a modest rally to 65.76 by January 6. The USDA supply/demand report on January 12 was bullish against expectations but not enough to spark more than a minor, one-day rally. US 2025/26 cotton production came in at 13.92 million bales versus an average trade expectation of 14.20 million and 14.27 million in the December update. Exports were left unchanged at 12.20 million bales despite the slow pace of US export sales. US ending stocks fell to 4.20 million bales, lower than the 4.56 million expected and down from 4.50 million in December. This pulled the stocks/use ratio down to 30.4% from 30.9% in December but still above the five-year average at 26.4% and the highest since 2022/23.
SUGAR
March Sugar continues to consolidate, supported by ideas of an oversold status and a possible shift to more ethanol production but limited by a large global surplus. The Indian government has allowed exports of 1.5 million metric tons this year, but only minimal sales have been reported so far. CovrigAnalytics recently projected the global sugar surplus for 2025/26 at 4.7 million metric tons, up 600,000 tons from their previous forecast. The recent UNICA report showed Brazil Center-South cane crush during the second half of December totaled 2.171 million metric tons, up from 1.714 million a year ago but down from 5.960 million for the first half of the month. Sugar production totaled 56,000 tons, down from 66,000 a year ago and 261,000 for the first half of the month. Processors continued to focus more of their efforts on ethanol and less on sugar. Sugar’s share of the crush was 21.2% during the second half of December versus 32.7% for the same period last year and the lowest going back at least two years.
CRUDE OIL
Nearby Crude Oil fell to its lowest level since February 2021 in early January on a peak of geopolitical calm. The Trump administration and European counterparts were optimistic about a peace deal for the Ukraine/Russia war, leaving open the possibility of sanctions being lifted on Russian crude. But then the US action against Venezuelan oil tankers notched geopolitical concerns up a bit and pushed the peace talks out of the headlines, which allowed the market rally some $7.40 per barrel over the next four weeks. The fact that Russia and Ukraine were hitting each other’s energy infrastructure also lent support. The US blockade succeeded in shutting down Venezuelan production, forcing buyers in China and India to look for other sources in the Mideast. The market fell off in the immediate aftermath of the Maduro capture on ideas it would open up Venezuelan supply, but not enough to take out the December low, as the trade realized it would take some time to restore their production after several years of disinvestment.
NATURAL GAS
Nearby Natural Gas prices fell steadily during December, reaching their lowest level since October, as warm weather in the US lowered heating demand and prevented a normal, seasonal drawdown in US supply. Gas production in the lower 48 states reached 109.7 billion cubic feet per day in December, a new record. But that all change in the third week of January with the arrival of very cold weather in the eastern half of the US which not only was expected to boost heating demand but also reduce supply. On January 23, Chicago area temperatures were as low as are -12 Fahrenheit (with a -36 wind-chill). The cold weather extended all the way south into Texas and the southeast, and the 6-10 and 8-14-day forecast had below-normal temperatures from the Great Plains all the way to the east coast. There were concerns that the cold would cause “freeze-offs,” a situation where moisture near the well caps freezes and blocks the gas from coming out of the wells.
LIVE CATTLE
Wholesale and retail beef prices made record highs in 2025. Feeder Cattle and Fed Cattle prices soared. Cattle producers had record profits. And although the USDA’s numbers haven’t been officially tabulated, 2025 will be a record year for beef imports into the US, even with tariffs on largest exporting countries. Feedlots pumped feed into cattle, cattle were left on feed for long durations, and cattle weights rose to record highs. Open interest in Live Cattle futures moved to historic highs.
LEAN HOGS
The December Quarterly Hogs and Pigs Report showed the US hog inventory on December 1, 2025 was up 1% from December 1, 2024 and slightly higher than it was on September 1, 2025. December 2025 – February 2026 farrowings are expected to be up 2% from 2024-25, and March– May farrowings are expected to be 2% higher as well. The number of pigs per litter continues to increase. Global hog numbers are increasing as well and are cutting into US exports. Brazil’s 2026 pork production is expected to continue to grow in 2026, and their already record exports are expected to increase another 6.3%. Russia is quickly expanding is production, and it is expected to become the fifth-largest exporter in the world in 2026, with expected increases to China and other Asian countries.
STOCK INDEX FUTURES
Apart from the Dow, stock index futures have faltered over the past month, as blue chip stocks have proved resilient and large-cap tech stocks have continued to face scrutiny over high valuations. The S&P 500 was little changed since mid-December, the Nasdaq slipped around 1%, and the Dow Jones advanced nearly 1.5%, hitting an all-time high of 49,633.35 on January 12. Tech stocks continue to experience moderate volatility. Expectations of Fed policy had a marginal impact on equity performance. US economic has reflected a cooling, yet stable, labor market. December’s payrolls were neutral, with the economy adding 50,000 jobs, while November’s were downwardly revised from 64,000 to 56,000. The unemployment rate edged back down to 4.4% from 4.5%, suggesting that the level of hiring in the economy was supportive enough to keep labor conditions stable
US DOLLAR INDEX
The US Dollar Index experienced a strengthening throughout the first part of January, as economic data has bolstered the case for the Fed to remain on hold in the near term. December’s CPI showed that prices rose 2.7% on the year, matching November’s figure. While it is too early for officials at the Fed to celebrate the reading, recent inflation figures have suggested that tariffs’ impact on consumer prices has been milder than initially expected. However, the data was also a reminder that inflation remains above the Fed’s 2% target rate, and that paired with a stable labor market could buy Fed officials more time to leave rates where they are.
EURO CURRENCY
The European Central Bank left borrowing costs unchanged as expected in early December, and it raised some growth projections as well. Inflation is still seen dipping below 2% next year and in 2027 as well, mostly on lower energy costs, but it is expected to come back to target in 2028, underpinning policymakers’ arguments that no policy change is needed for some time. Growth is expected to be slightly stronger this year than earlier predicted, as the bloc is proving resilient to global trade tensions and Chinese goods dumping. GDP is to grow at 1.4% in 2025, 1.2% in 2026, and 1.4% in 2027. Eurozone Inflation in December came in at 1.9%, below November’s figure of 2.1%.
JAPANESE YEN
The yen has experienced moderate volatility since mid-December, with recent pressure on the currency coming in response to a snap election called by Prime Minister Takaichi for February 8. The call for elections marks a high-risk gamble to for Takaichi to gain a stronger mandate and more control of her agenda. She enjoys popular support, but her former coalition partners have merged with the main opposition party, potentially stirring market-unfriendly uncertainty. The yen has fallen since her election in response to her stance on fiscal policy, which emphasizes debt-fueled spending to grow the economy.
INTEREST RATES
The US Treasury market has seen a substantial flattening in the curve, reversing a strong steepening move during the November-December period. Yields have been lifted by economic data that has been supportive of a case for the Fed to hold rates steady in the short term. Treasury yields have been range-bound, though they spiked in the second half of January in response to President Trump’s threats of imposing additional tariffs on key US allies. This threats were pulled back after the president announced an agreement on a framework for a deal on Greenland. Recent data on the economy has supported the case to hold rates steady as the Fed it continues to tackle inflation.
GOLD
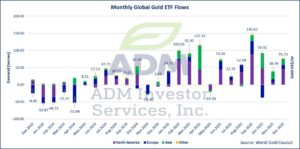
Gold has risen more than 10% since mid-December, supported by the same themes that brought it to record highs in 2025. Volatility in the equity markets, a weakening dollar, and geopolitical uncertainty served as the main catalysts. February Gold neared $4,900, as the metal continued to see strong safe-haven flows and investor interest despite high price.
COPPER
US copper prices have risen as more copper has continued to ship to the US in anticipation that additional US tariffs will be announced in mid-2026 and implemented in 2027. That dynamic used to support LME-COMEX arbitrage, but as US inventories grow more 500,000 tons and LME stocks moved above 100,000 tons arbitrage opportunities have faded. LME copper has flipped above COMEX, sending the metal back to LME warehouses and lifting stock levels. The market is moving from a “tight” to a more balanced condition, reducing the urgency behind the rally.
Interested in more futures market commentary? Explore our Market Dashboards here.
