Written Commentary
SOYBEANS
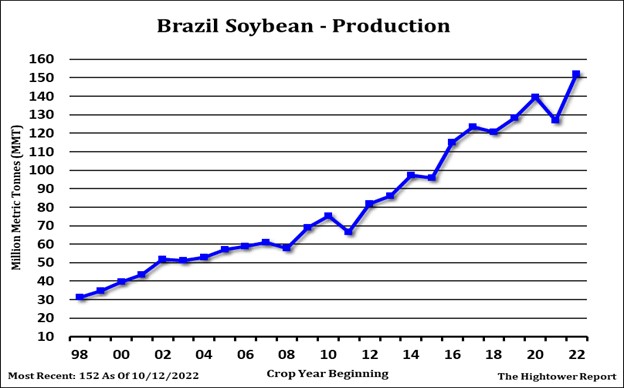
Talk of lower UK economy rallied US Dollar which weighed on stocks which weighed on most commodities. It feels like weeks since USDA released US and World supply and demand. USDA estimated US soybean crop at 4,313 mil bu and down 65 from Sep. Export were down 40 mil bu and crush was up 10. The carryout was left at 200. SX rallied from 13.67 to 14.05. Weekly US export sales were 8 mil bu. Total commit is near 1,037 vs 967 last year. Some feel final exports could be closer to 1,900. USDA raised World soybean crop 1 mmt, exports 1 mmt and end stocks 2 mmt. Brazil crop is a record 152 mmt.
CORN
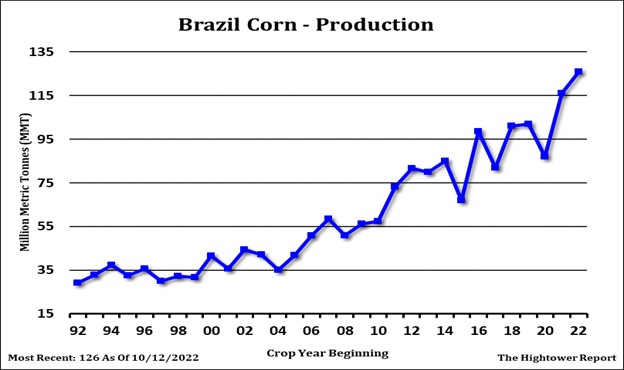
USDA estimated US corn crop at 13,895 mil bu and down 49 from Sep. The carryin was down 148 mil bu. USDA raised feed 50, lowered ethanol 50 and exports 125 mil bu. The carryout was dropped from 1,219 to 1,172. CZ rallied from 6.80 to 7.00. Weekly US export sales were 8 mil bu. Total commit is near 528 vs 1,087 last year. Some feel final exports could be closer to 2.000. USDA lowered World corn crop 4 mmt, domestic use 6 mmt and dropped end stocks 3 mmt to 301. Brazil crop is a record 126 mmt. with exports 47 mmt vs 44 ly. USDA raised Ukraine corn exports 2,5 mmt to 15.5 vs 27 ly. CZ holding in a 6.50-7.00 range until more is known about Ukraine exports and South America weather. Poor river logistics and potential rail strike could offer resistance to basis and futures.

WHEAT
Wheat futures ended lower. Since August lows, WZ rallied from 7.43 to 9.50. KWZ rallied from 8.08 to 10.37. MWZ rallied from 8.61 to 10.24. Most of the rally was due to US and EU weather and uncertainty over Black Sea exports. Talk of lower World food demand, higher Dollar and higher Interest rates limited new buying above 9.50 WZ, 10.00 KWZ and MWZ. WZ support is 8.00. USDA dropped US wheat crop 133 mil bu. Feed use was lowered 30 mil bu and exports 50 mil bu. US wheat exports are 50 year low. US 2022/23 carryout is 576 or down 34 mil bu. HRW is 253 vs 360 ly. HRS 130 VS 140. SRW 91 vs 125 in Sep and 94 ly. USDA est World carryout at 267 mmt vs 276 ly. Of the total, China is 144. World exports are 208 mmt vs 202 ly. Russia is 42 vs 33 ly. EU is 35 vs 32 ly. Key is Black Sea exports and 2023 weather.
Futures and options trading involve significant risk of loss and may not be suitable for everyone. Therefore, carefully consider whether such trading is suitable for you in light of your financial condition. The information and comments contained herein is provided by ADMIS and in no way should be construed to be information provided by ADM. The author of this report did not have a financial interest in any of the contracts discussed in this report at the time the report was prepared. The information provided is designed to assist in your analysis and evaluation of the futures and options markets. However, any decisions you may make to buy, sell or hold a futures or options position on such research are entirely your own and not in any way deemed to be endorsed by or attributed to ADMIS. Copyright ADM Investor Services, Inc.
