Written Commentary
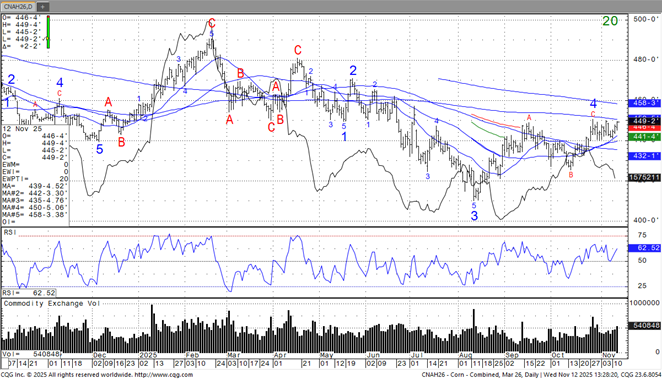
CORN
SF is near 11.28. Trade awaits Fridays USDA report. Trade estimates US soybean crop at 4,266 mil bu vs USDA Sep est of 4.301. The big number could be US 25/26 soybean carryout. Trade est carryout at 304 mil bu vs 300 in Sep but range is 187 to 494. Key could be if WOB shows higher exports due to China deal or not. SF has been in technical rally since October low near 10.70 to recent high near 11.33. We estimate that Managed funds have bought 80,000 soybean contracts are now long 100,000. They also covered some of their soymeal short and are long soyoil. Some will begin to watch dryness across C Brazil but rains are forecasted there next week.
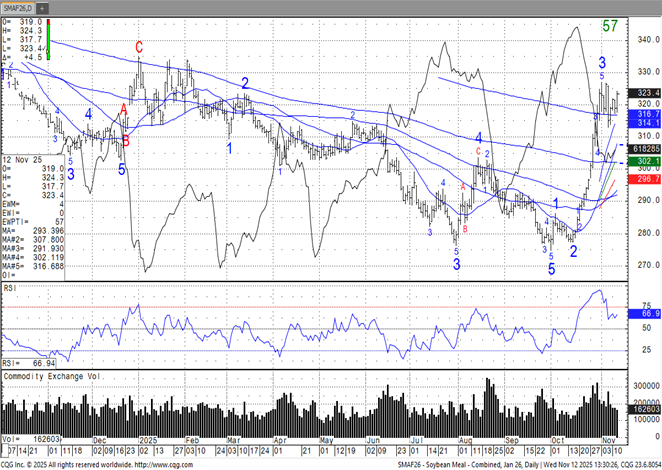
SOYBEANS
Prices were mixed as beans ranged from $.03 lower to $.01 higher, meal was $2-$3 lower while bean oil was up 50-55 points. Spreads weakened across the complex. Inside trade for Jan-26 beans as it holds close to its 16 month high. Dec-25 meal likely felt pressure from news Brazil is now approved to export both sorghum and DDG’s to China. Dec-25 oil shot up to a 3 week high drawing support from higher energy prices. Jan-26 crush margins improved $.02 ½ to $1.40 bu. while bean oil PV improved to a 2 week high at 44.6%. Mostly favorable weather conditions in Brazil should work to limit further upside potential. China has still not publicly acknowledged they have agreed to purchase 12 mmt of US beans by the end of the year, or 25 mmt every year over the next 3 MY’s. US FOB offers at the Gulf are already $.30 bu. over Brazilian offers for Jan. shipment and it only gets wider from there as we get deeper into Brazil’s harvest. This is even before the 10% tariff differential that works against the US competitiveness. China continues to show no interest in US soybeans. The average soybean production est. in the Reuters survey at 4.266 bil. bu. is down 35 mil. from Sept. and about 25 mil. above our estimate. Ending stocks however are expected to be little changed from the Sept forecast of 300 mil. bu. as the lower production is likely to be offset by lower demand, most likely exports due to the lack of sales to China. EU 25/26 soybean imports as of Nov. 9th at 4.15 mmt are down 16.5% YOY. Their meal imports at 6.5 mmt are down 4.3%.
WHEAT
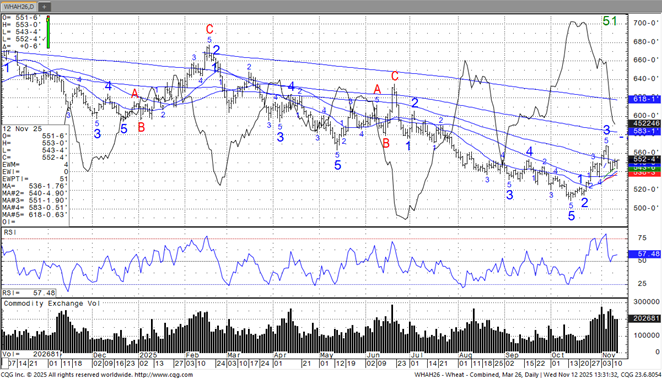
WH is near 5.51. KWH is near 5.41. MWZ is near 5.84. WH has been in a technical uptrend sine Oct low near 5.08 to recent high near 5.68 on increase volume but sharp drop in open interest. For the most part wheat futures have been a follower to higher soybean futures and rumors China was a buyer of US wheat. Argentina and Russia wheat export prices are now below US. Trade est US wheat carryout at 867 mil bu vs 844 in Sep. A bigger number could be World ending wheat stocks est at 266.1 mmt vs 264.0 in Sep and one est near 270.0.
Charts provided by QST.
Futures and options trading involve significant risk of loss and may not be suitable for everyone. Therefore, carefully consider whether such trading is suitable for you in light of your financial condition. The information and comments contained herein is provided by ADMIS and in no way should be construed to be information provided by ADM. The author of this report did not have a financial interest in any of the contracts discussed in this report at the time the report was prepared. The information provided is designed to assist in your analysis and evaluation of the futures and options markets. However, any decisions you may make to buy, sell or hold a futures or options position on such research are entirely your own and not in any way deemed to be endorsed by or attributed to ADMIS. Copyright ADM Investor Services, Inc.
