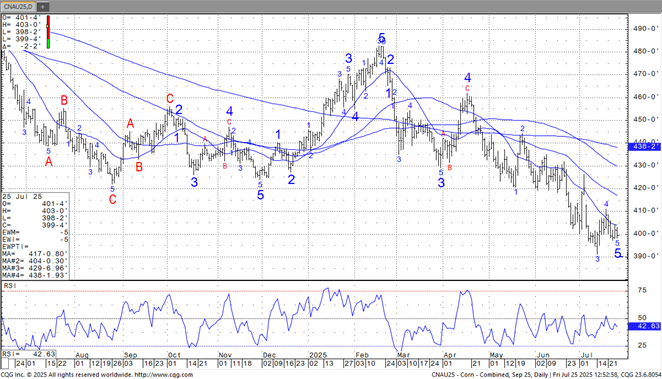
CU is near 3.99. For the month of July, nearby corn futures dropped from 4.35 to current price near 3.99. USDA raised their estimate of US 24/25 corn exports 100 mil bu but dropped feed and residual 75 mil bu. Net result was a drop of 25 mil bu in carryout to 1,340. USDA est average farm corn price near 4.30 versus 4.55 last year. USDA dropped US 2025 corn crop 115 mil bu. They dropped feed and residual 50 mil bu. Net result was a carryout closer to 1,660 versus June estimate of 1,720. USDA est average farmer corn price near 4.20. This week, US corn export sales were 25 mil bu. Total commit is near 2,760 vs 2,167 last year and USDA goal of 2,750.
SOYBEANS
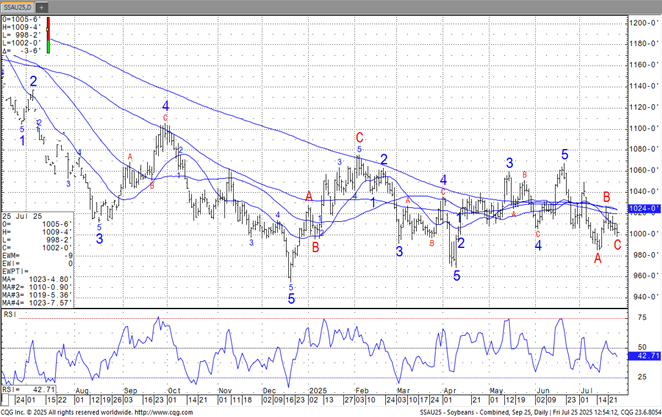
SU is near 10.00. For the month of July, nearby soybean futures dropped from 10.61 to current price near 10.00. USDA raised their estimate of US 24/25 soybean exports 15 mil bu but dropped residual 15 mil bu. Net result was an unchanged carryout to 350. USDA est average farm corn price near 10.00 versus 12.40 last year. USDA dropped US 2025 soybean crop 5 mil bu. They dropped exports 70 mil bu but raised crush 50 mil bu. Net result was a carryout closer to 310 versus June estimate of 295. USDA est average farmer corn price near 10.10 versus June est of 10.25. This week, US soybean export sales were 6 mil bu. Total commit is near 1,867 vs 1,658 last year and USDA goal of 1,865. USDA also raised 25/26 soyoil biofuel use 1,400 mil lbs but dropped exports 1,000 mil lbs.
WHEAT
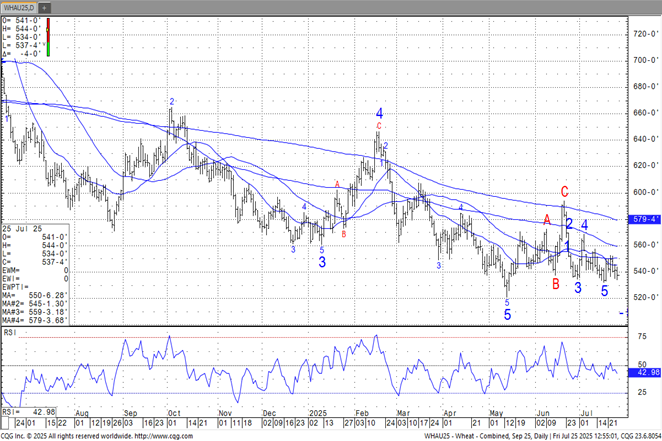
For the month of July, nearby Chicago wheat futures dropped from 5.58 to 5.26 but has bounced to current price near 5.36. USDA raised their estimate of US 24/25 wheat exports 6 mil bu but dropped residual 17 mil bu. Net result was an increase carryout to 851. USDA est average farm corn price near 5.51 versus 6.96 last year. USDA raised US 2025 wheat crop 8 mil bu. They raised 25/26 exports 25 mil bu. Net result was a carryout closer to 890 versus June estimate of 898. USDA est average farmer wheat price near 5.20 versus June est of 5.40. This week, US wheat export sales were 26 mil bu. Total commit is near 328 vs 294 last year.
All charts are provided by The Hightower Report.
Futures and options trading involve significant risk of loss and may not be suitable for everyone. Therefore, carefully consider whether such trading is suitable for you in light of your financial condition. The information and comments contained herein is provided by ADMIS and in no way should be construed to be information provided by ADM. The author of this report did not have a financial interest in any of the contracts discussed in this report at the time the report was prepared. The information provided is designed to assist in your analysis and evaluation of the futures and options markets. However, any decisions you may make to buy, sell or hold a futures or options position on such research are entirely your own and not in any way deemed to be endorsed by or attributed to ADMIS. Copyright ADM Investor Services, Inc.