Written Commentary
CORN
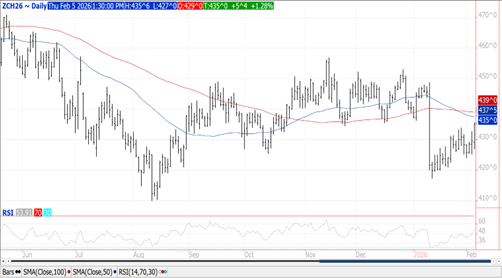
Prices were $.04-$.06 higher closing near session highs. Spreads were mixed. Mch-26 pushed to its highest level since the January USDA report day however remain rangebound between $4.15-$4.40. No mention of China potentially buying US corn. Yesterday’s EIA report showed ethanol production LW at 281 mil. gallons was the lowest in nearly 2 years impacted by the frigid Midwest temperatures. Exports at 41 mil. bu. were at the low end of expectations. YTD commitments at 2.312 bil. bu. are up 31% from YA, vs. the USDA forecast of up 12%. Commitments represent 72% of the USDA forecast, above the historical average of 63%. Noted buyers were Japan and Mexico at just under 10 mil. each. Despite the strong pace to exports, I see no change in this month’s WASDE holding at 3.2 bil. bu. Lowered FOB offers from Argentina are starting to cut into US demand. Brazilian exports in Jan-26 at 4.25 mmt were up 18% YOY.
SOYBEANS
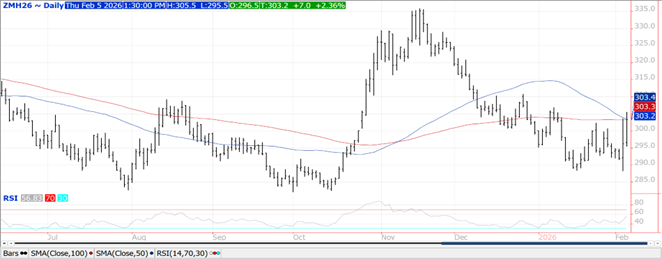
Prices were mostly higher across the complex with beans up $.10-$.21, meal surged $6-$7 while oil was steady. Bean and oil spreads were mixed while meal spreads firmed. Despite being $.20 higher Mch-26 beans held within yesterday’s range. After trading to a fresh 5 ½ month high overnight, Mch-26 oil failed to trade above $.56 lb. setting up the price pullback. Mch-26 meal surged to its highest level in a month while closing very close to its 50/100 day MA’s. Spot board crush margins pulled back another $.04 ½ to $1.67 bu. while bean oil PV slipped just below 48%. While it may not make economic sense for China to buy more US beans, they did buy 12 mmt Nov-25 thru Jan-26 at prices above what they could have secured from Brazil. Price volatility likely to remain high leading up to EPA decision on RVO’s and SRE’s in March and Trump’s visit to China in April. Addition Chinese buying, or lack thereof, along with price differentials between US and SA to drive prices. Another 8 mmt of old crop soybean sales to China would be a game changer for the US balance sheet. Instead of looking at a 25-50 mil. bu. reduction, we could be talking about 25-50 mil. bu. increase driving stocks closer to 300 mil. bu. Bean sales at 16 mil. were below expectations. Commitments at 1.260 bil. are down 20% from YA vs. the USDA forecast of down 16%. Sales to China at 233k mt (half switched from unknown) bring total sales to 9.9 mmt with another 3.1 mmt to unknown. Shipments to China are just over 4.3 mmt. Meal sales at 380k tons brought YTD commitments to 10,651k tons up 9% YOY vs. the USDA forecast of up 5%. Bean oil commitments at 742 mil. lbs. are down 50% YOY in line with the USDA forecast. Brazilian exports in Jan-26 at 1.88 mmt vs. only 1.07 mmt YA.
WHEAT
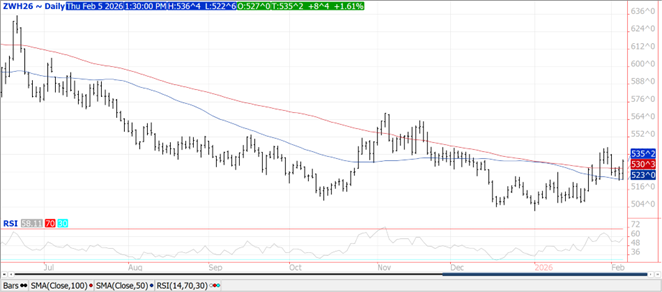
Wheat got caught up in the bullish draft with prices up $.05-$.09 today. Prices weren’t impacted by Pres. Trump’s Truth Social post yesterday. CGO Mch-26 popped back above its 100 day MA with next resistance at LW’s high of $5.44 ¾. KC Mch-26 held MA support at $5.26 ½ in overnight trade setting up the midday recovery. The 6-10 and 8-14 day outlooks continue to call for above normal precipitation in winter wheat areas however so far these rains haven’t moved forward. Exports at 14 mil. bu. were in line with expectations bringing YTD commitments to 802 mil. bu. up 18% from YA, vs. the USDA forecast of up 9%. Commitments represent 89% of the USDA forecast, above the historical average of up 83%. By class commitments vs. USDA forecast are HRW +78% vs. USDA +47%, SRW +4% vs. -2%, HRS down 6.5% vs. -8%, and white down 1% vs. -5%. US winter wheat acres in drought rose 2% to 43% nearing the 52 week high of 45%.
Charts provided by CQG
Futures and options trading involve significant risk of loss and may not be suitable for everyone. Therefore, carefully consider whether such trading is suitable for you in light of your financial condition. The information and comments contained herein is provided by ADMIS and in no way should be construed to be information provided by ADM. The author of this report did not have a financial interest in any of the contracts discussed in this report at the time the report was prepared. The information provided is designed to assist in your analysis and evaluation of the futures and options markets. However, any decisions you may make to buy, sell or hold a futures or options position on such research are entirely your own and not in any way deemed to be endorsed by or attributed to ADMIS. Copyright ADM Investor Services, Inc.
